2.19. Measurements
 | To avoid errors caused by the discrepancy between the image size and the real size, Calibration tool should be used when working with projection images (e.g. X-ray images) (see Section 2.37). |
| | The measurement accuracy is up to one screen pixel. As a screen pixel is smaller than a source image pixel, the true linear measurement accuracy is up to one source image pixel. Errors may also occur in density measurements. The most accurate measurements are performed with bilinear interpolation (see Section 2.5). |
The following tools are used to measure various parameters: Ruler, Polygonal ruler, Angle, Cobb angle, Point value, ROI rectangle, ROI ellipse, ROI polygon. To select one of these tools, click on the arrow on the tool selection button. The button will look different depending on the selected tool:
 | Ruler (selected by default) |
 | Polygonal ruler |
 | Angle |
 | Cobb angle |
 | Point value |
 | ROI rectangle |
 | ROI ellipse |
 | ROI polygon |
 | Cardiothoracic ratio(PRO) |
 | TT-TG distance(PRO) |
To activate or deactivate the tool that is currently selected, just click on the tool selection button. If some tool is activated, the button is highlighted. The drawn objects will be displayed in the window while it is open, and you can pan, zoom or rotate them together with the image.
If the series is open in multiple windows or tabs, the measurements made in any window, appear in all the other windows.
2.19.1 Ruler
To measure distance in an image:
-
Activate the Ruler
tool on the toolbar by clicking the left/right/middle mouse
button. To continue work with this tool, use the button with which the tool was activated.
To learn more about tool control, see Section 1.14.
-
You can measure the distance in two ways:
-
Mark the first point by clicking the mouse button. Drag the cursor over the screen. The distance from the first point to the current point will be displayed beside the line. To fix the current point, click the mouse button.
-
Click on the mouse button at the starting point and move the cursor to the endpoint while holding the mouse button. The distance from the first point to the current point will be displayed beside the line. To fix the endpoint, release the mouse button.
-
-
To cancel an incomplete measurement, press Esc.
This tool is also available from the image context menu and from the Image main menu item. Activation is only possible with the left mouse button.
The measurement results are not saved in the project file. To save the measurement results, export the current image to a file (see Section 2.28) or use marker lines (see Section 5.12.3).
2.19.2 Displaying angles between intersecting rulers
____________________________________________________________________________________________
Functionality is available in the Pro edition
____________________________________________________________________________________________
The DICOM Viewer provides an opportunity to see the base and the adjacent angle when
two Ruler tools cut each other in the Image Viewer, MPR reconstruction,
Vessel analysis, Coronary artery analysis, PET analysis, and Cardiac analysis
tabs.
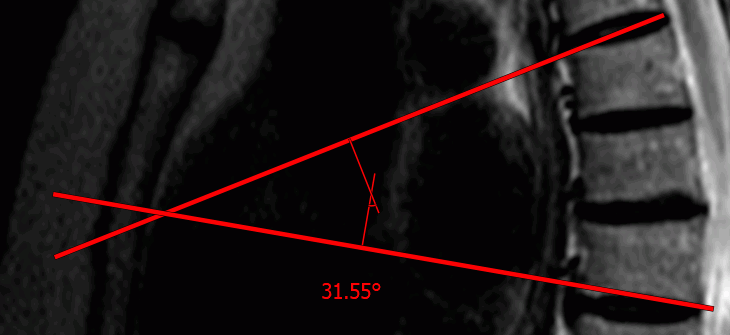
To see the angle between two intersecting Ruler tools, check the Show angles between rulers(PRO) box in the Tool options dialog box. The box is checked by default. You can choose whether only the base angle or both (the base and the adjacent) angles are to be shown (see Section 2.19.10).
The base angle between the rulers is marked with a single arc, and the adjacent angle is marked with a double arc. The angle value is shown in degrees as a separate note.
2.19.3 Polygonal Ruler
To perform plygonal linear measurements:
-
Activate the Polygonal ruler
tool by clicking the left/right/middle mouse button.
To continue work with this tool, use the button with which the tool was activated. To
learn more about tool control, see Section 1.14.
-
Mark the first point on the toolbar by clicking the mouse button.
-
Drag the cursor over the screen. The distance from the first point to the current point will be displayed beside the line.
-
To fix the current point, click the mouse button.
-
Repeat Steps 3 and 4 until the last but one point is fixed.
-
Fix the last point by double-clicking the mouse.
-
To cancel an incomplete measurement, press Esc.
To move the linear measurement point:
-
Locate the cursor on the point to be moved.
-
Drag the point, holding down the left mouse button or the button to which this tool is assigned;
-
Release the mouse button.
To delete a point:
-
Locate the cursor on the point to be deleted.
-
Right-click the mouse and select the Remove point command.
To insert a point:
-
Locate the cursor on the ruler where you want to insert a point.
-
Right-click the mouse and select the Insert point command.
This tool is also available from the image context menu and from the Image main menu item. Activation is only possible with the left mouse button.
The measurement results are not saved in the project file. To save the measurement results, export the current image to a file (see Section 2.28) or use polygonal marker lines (see Section 5.12.4).
2.19.4 Angle
To measure an angle:
-
Activate the Angle
tool from the toolbar by clicking the left/right/middle mouse
button. To continue work with this tool, use the button with which the tool was activated.
To learn more about tool control, see Section 1.14.
-
Put two points on the image, clicking the mouse button. The second point is the angle apex.
-
Move the cursor over the screen to set the other side of the angle.
-
Click the mouse button to fix the second side of the angle.
-
To cancel an incomplete measurement, press Esc.
The DICOM Viewer allows you to build as many angles as you need. To deactivate the tool, click on the tool selection button.
This tool is also available from the image context menu and from the Image main menu item. Activation is only possible with the left mouse button.
The measurement results are not saved in the project file. To save the measurement results, export the current image to a file (see Section 2.28) or use polygonal marker lines (see Section 5.12.4).
2.19.5 Cobb angle meter
To measure a Cobb angle:
-
Activate the Cobb angle
tool from the toolbar by clicking the left/right/middle
mouse button. To continue work with this tool, use the button with which the tool was
activated. To learn more about tool control, see Section 1.14.
-
Draw a line that runs along the border of one of the vertebrae. To do this, click the mouse button to set two points through which the line must pass.
-
Likewise, construct a line for the second vertebra.
-
To cancel an incomplete measurement, press Esc.
To display additional parameters, hover the mouse over the measurement tool or the measurement value. Right-click the mouse and select the Tool options... item from the context menu.
In the Tool options dialog box, provide the measurement name, as well as the color, the line width, and the font size for the angle value. To join the measurement value to the angle with a dashed line, check the Footnote line box.
To display the value of the adjacent angle, check the Adjacent angle box.
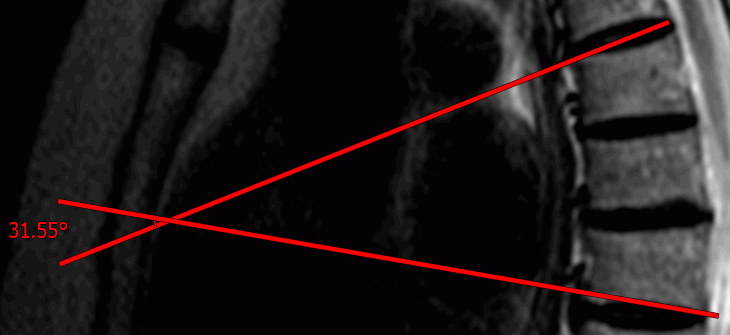
To show the angle value at the intersection of segments, check the Show intersection box. If this function is disabled or the segments do not intersect, the angle value is shown only at the intersection of normals. In Fig. 2.30 the option Show intersection is disabled, and in Fig. 2.31 is enabled.
To use these parameters by default, check the box Set as default.
To apply the settings, click OK. To cancel, click CANCEL.
To delete mesurement, locate the cursor on it, right-click the mouse and select the Remove object. For more information see Section 2.19.13.
This tool is also available from the image context menu and from the Image main menu item. Activation is only possible with the left mouse button.
The measurement results are not saved in the project file. To save the measurement results, export the current image to a file (see Section 2.28) or use polygonal marker lines (see Section 5.12.4).
2.19.6 Measure Intensity at a Point
| | If non-bilinear interpolation filters are used, significant errors may occur when intensity is measured in a certain point. In this case, the intensity value will be marked by an asterisk. For more accurate measurements, use the bilinear interpolation filter (see Section 2.5). |
To measure intensity at some point:
-
Activate the Point value
tool from the toolbar by clicking the left/right/middle
mouse button. To continue work with this tool, use the button with which the tool was
activated. To learn more about tool control, see Section 1.14.
-
Click the mouse button on the target point.
The point will be highlighted at the image, and the intensity value will be displayed next to it. It is shown in the "k HU" format for original images and in "k", where k is the intensity value at the point. If the value is inaccurate, you will see a "*" symbol next to it.
If you apply a filter to an image, you will see an asterisk "*" symbol next to the intensity value. It informs the user that the measurement results are affected by the filter applied (see Section 2.6).
| | An image to which a filter has been applied is not original, and the measurement results may be inaccurate. |
To adjust the Point value tool, locate the cursor on the point or the mesurement results on the image. Right-click the mouse and select the Tool options... item from the context menu. In the Tool options dialog box enter the measurement name. Set the color and the font size. To connect the block with the measurement results with a dotted line, the Footnote line box must be checked. To use these parameters by default, check the box Set as default.
To apply the settings, click OK. To cancel, click CANCEL.
To delete mesurement, locate the cursor on it, right-click the mouse and select the Remove object.
This tool is also available from the image context menu and from the Image main menu item. Activation is only possible with the left mouse button.
The measurement results are not saved in the project file. To save the measurement results, export the current image to a file (see Section 2.28).
2.19.7 Measure the Intensity Average and Standard Deviation in an Area
To measure the average intensity value and standard deviation in a particular area:
-
Activate one of the ROI ... tools (rectangle
, ellipse , or polygon ) from
the toolbar by clicking the left/right/middle mouse button. To continue work with this
tool, use the button with which the tool was activated. To learn more about tool control,
see Section 1.14.
-
You can draw a rectangle in two ways:
-
Click the mouse button to mark the first corner of the rectangle. Move the cursor to the place where the opposite corner of the rectangle should be located. The rectangle will be displayed on the screen. To fix the second corner of the rectangle, click the mouse button.
-
Click the mouse button to mark the first corner of the rectangle and move the cursor to the place where the opposite corner of the rectangle should be located while holding the mouse button. The rectangle will be displayed on the screen. To fix the point, release the mouse button.
-
-
To draw an ellipse, just draw the rectangle the ellipse is inscribed in.
-
To draw a polygon, click the mouse button to mark each apex and then double-click the mouse to finish.
-
To cancel an incomplete measurement, press Esc.
These tools are also available from the image context menu and from the Image main menu item. Activation is only possible with the left mouse button.
The following parameters will be displayed next to the highlighted area:
-
minimum intensity value;
-
maximum intensity value;
-
average intensity value;
-
standard deviation;
-
area perimeter;
-
area space.
If you apply a filter to an image, you will see an asterisk "*" symbol in the ROI measurement results line. It informs the user that the measurement results are affected by the filter applied (see Section 2.6).
| | An image to which a filter has been applied is not original, and the measurement results may be inaccurate. |
2.19.8 Measuring the Cardiothoracic Ratio (CTR)
____________________________________________________________________________________________
Functionality is available in the Pro edition
____________________________________________________________________________________________
To measure the cardiothoracic ratio, proceed as follows:
-
Activate the Cardiothoracic ratio
tool from the toolbar by clicking the
left/right/middle mouse button. To continue work with this tool, use the button with
which the tool was activated. To learn more about tool control, see Section 1.14.
-
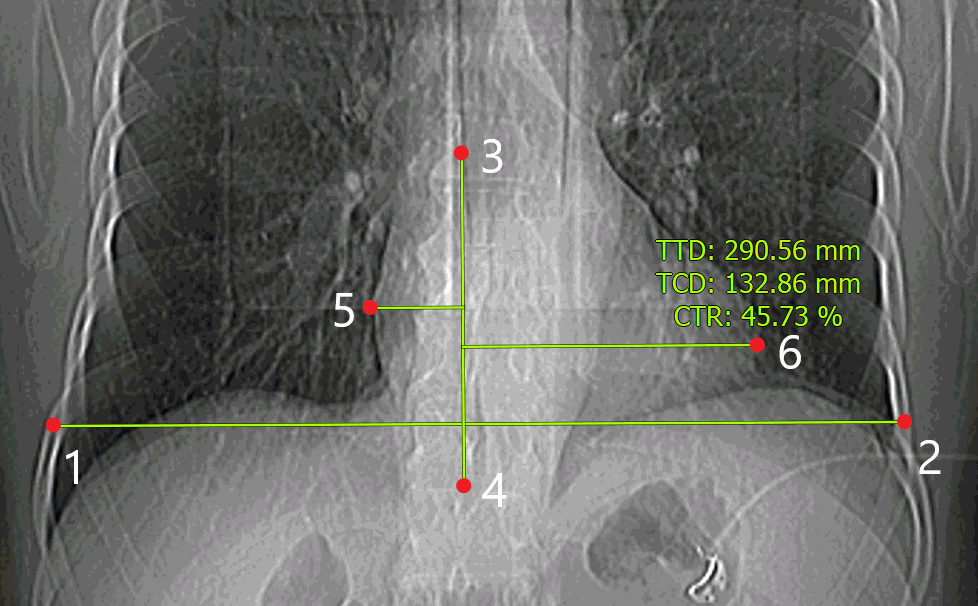
Measure the thoracic diameter by marking points on the inside of the ninth rib (points 1 and 2 in Fig. 2.32).
-
Build the vertebral column axis (points 3 and 4 in Fig. 2.32).
-
Measure the transverse cardiac diameter by marking the outermost points of the left and the right contours (points 5 and 6 in Fig. 2.32).
-
To cancel an incomplete measurement, press Esc.
Next to the measurement, you can see the following results:
-
transverse thoracic diameter (TTD)) in millimeters;
-
transverse cardiac diameter (TCD) in millimeters;
-
cardiothoracic ratio (CTR) as a percentage.
This tool is also available from the image context menu and from the Image main menu item. Activation is only possible with the left mouse button.
2.19.9 TT-TG distance measurement
____________________________________________________________________________________________
Functionality is available in the Pro edition
____________________________________________________________________________________________
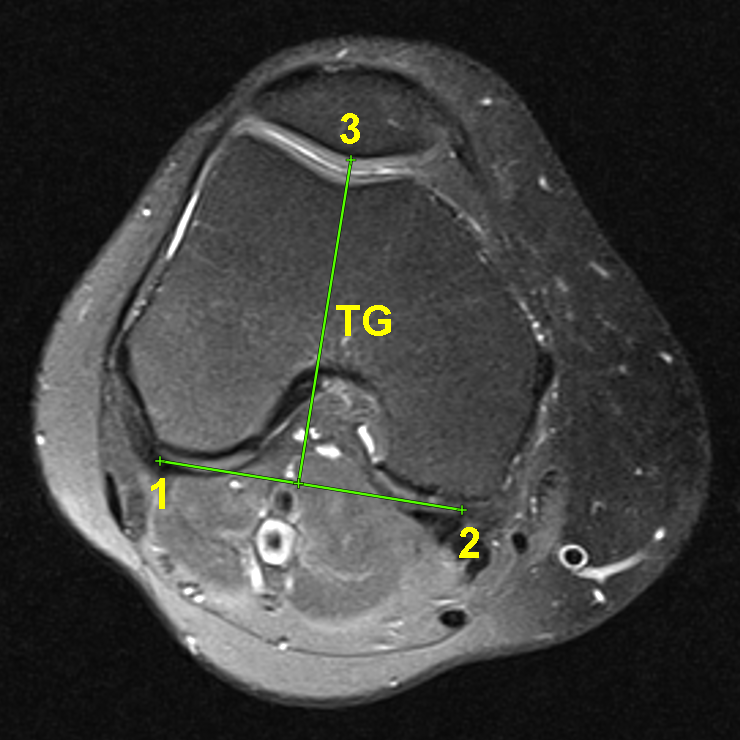
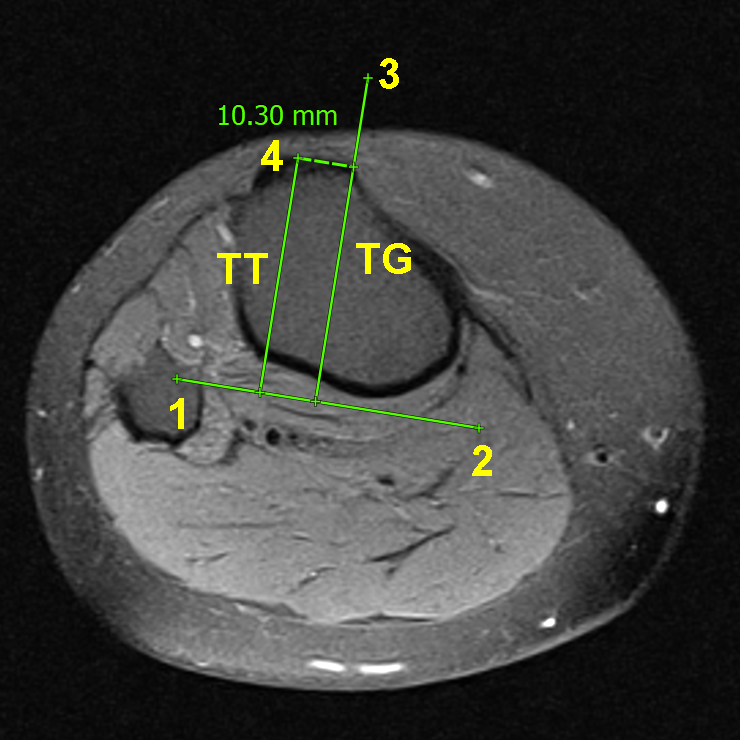
In orthopedics, TT-TG distance measurement (Tibial Tuberosity–Trochlear Groove distance) is
used to assess knee joint stability, in particular the position of the patella (kneecap). The
TT-TG distance is the distance between the tibial tuberosity and the femoral trochlear
groove.
CT and MR series acquired in the axial plane are suitable for TT-TG distance measurement.
To measure the TT-TG distance, proceed as follows:
-
Open a series suitable for TT-TG distance measurement in the flat image view window.
-
Activate the TT-TG distance tool by clicking the
button with the left, right, or
middle mouse button. For further work with the tool, use the button with which it was
activated. To learn more about tool control, see Section 1.14.
-
Select the femoral slice where the intercondylar groove (femoral trochlear groove) is seen most clearly. Draw the baseline along the posterior margins of the condyles by placing points 1 and 2 (Fig. 2.33 "a").
-
Drop a perpendicular from the deepest point of the groove to the baseline by placing point 3 (Fig. 2.33 "a"). The perpendicular forms the trochlear groove line TG.
-
Move to the slice where the tibial tuberosity projects most anteriorly. Mark the center of this tuberosity by placing point 4 (Fig. 2.33 "b"). The perpendicular dropped to the baseline forms the tibial tuberosity line TT.
The distance between the TT and TG lines is displayed as a dotted line, with the measurement result shown next to it. The constructed lines and the measurement result are displayed on both slices.
To cancel an incomplete measurement, press Esc on the keyboard.
This tool is also available from the image context menu and from the Image main menu item. Activation is only possible with the left mouse button.
2.19.10 Drawing Parameters
To set the default drawing parameters for measurement tools:
-
Click on the arrow on the measurement tool selection button.
-
Select the item Default tool options....
-
In the dialog box that appears, set the color by clicking on the color box.
-
Set the line thickness and the font size.
-
Set length and area units (millimetres or centimetres).
-
To connect the footnote and the measurement of the dotted line, check the box Footnote line.
-
To see the angle between two intersecting Ruler tools, check the Show angles between rulers(PRO)box. The box is checked by default.
-
Choose the angle display option:
-
if you want only the base angle to be shown, chose the Only one(PRO)option;
-
if you want the base and the adjacent angles to be shown, choose the Both (incl. adjacent angle)(PRO)option. This option is selected by default.
-
-
To apply the settings, click OK. To cancel, click CANCEL.
Drawing parameters are available as well from the image context menu and from the Image main menu item.
The settings will be applied only to the measurements conducted in the flat image view window. For multiplanar reconstruction, similar settings should be saved separately.
To edit the drawing parameters of an existing measurement:
-
Locate the cursor on the measurement to highlight a line or a point.
-
Right-click the mouse.
-
Select the Tool options... item from the context menu.
-
In the dialog box that appears, set the parameters in the same way as the default drawing parameters.
-
To use these parameters by default, check the box Set as default. Set the measurement name if necessary.
2.19.11 Move Measurements
To move a measurement:
-
Locate the cursor on the measurement to highlight the line or point or to magnify the cross, marking the angular point. Do not locate the cursor on angle points.
-
Move the measurement, holding down the left mouse button or the button to which this tool is assigned. To learn more about tool control, see Section 1.14.
2.19.12 Move Measurement Results
To move a measurement result:
-
Locate the cursor on the measurement so that it is highlighted by a dotted frame.
-
Move the measurement result, holding down the left mouse button or the button to which this tool is assigned. To learn more about tool control, see Section 1.14.
If the cursor is located on the measurement, the corresponding measurement result will be highlighted, and vice versa.
2.19.13 Delete Measurements
To delete annotations and measurements, locate the cursor on the measurement to highlight a line or a point and press the Delete key on the keyboard, or right-click the mouse and select the Remove object item from the context menu.
To delete all annotaions and measurements, click the Delete all annotations and
measurements  button on the toolbar or select the corresponding item from the Image main
menu. In the dialog box that appears, Click YES to delete or NO to cancel. If you want the DICOM
Viewer to always delete annotations and measurements without this confirmation, check the box
Don‘t show this dialog again and click YES. If you want the DICOM Viewer to show the
confirmation dialog, check the box Ask before deleting all annotations and measurements (see
Section 16.7.1).
button on the toolbar or select the corresponding item from the Image main
menu. In the dialog box that appears, Click YES to delete or NO to cancel. If you want the DICOM
Viewer to always delete annotations and measurements without this confirmation, check the box
Don‘t show this dialog again and click YES. If you want the DICOM Viewer to show the
confirmation dialog, check the box Ask before deleting all annotations and measurements (see
Section 16.7.1).
 | Please note that all other graphic objects created manually will be deleted as well. |
2.19.14 Measuring Dimensions and Area during Ultrasound Imaging
The Ruler, Polygonal ruler, ROI rectangle, ROI ellipse and ROI polygon tools may be used for linear and area measurements on ultrasound images (series with US modality).
Ultrasound study series may contain data on the areas of images with a certain pixel size.
If measuring tools are applied to the area of the image for which the pixel size has been determined, then the measurement units provided for in the tool parameters will be used for linear and area measurements (see Section 2.19.10).
If a line or a part of the measuring area stretches beyond the area for which the pixel size has been determined, linear and area measurements will be performed in pixels.
If the series does not contain any data on the areas for which the pixel size has been determined, linear and area measurements will be performed in pixels.
2.19.15 Measuring the Time Interval and the Blood Flow Velocity during Ultrasound Imaging
The Ruler and Polygonal ruler tools may be used for measuring the time interval and the blood flow velocity when performing ultrasound examination (series with US modality) with dopplergram.
| | For the Polygonal ruler tool, the values of the time interval and blood flow velocity are only shown when the measurement is made by two points. |
When measurements are performed, the measurement value is shown on the dopplergram image next to the segment built, in the X: x s Y: y cm/s format, where x is the value of the time interval in seconds (s) accurate up to hundredth; y is the value of the blood flow velocity in cm/s, accurate up to hundredth.
If the measurement is fully or partly performed beyond the Doppler area, the linear dimension will be shown next to the segment built. In this case, the measurement units depend on the current algorithm and program settings.
If no image areas are suitable for evaluation of the time interval and the blood flow velocity, then when a measurement is made, the linear value will be shown next to the segment built. In this case, the measurement units depend on the current algorithm and program settings.