5.22. Diffusion Tensor Imaging (DTI) Analysis Mode
____________________________________________________________________________________________
Functionality is available in a separate module which is activated in the Pro edition for an extra fee
____________________________________________________________________________________________
 | Tractography results cannot be used for establishing a diagnosis |
The DICOM Viewer in the MPR reconstruction and Volume reconstruction tabs allows you to show the result of the fiber tractography for the series of Diffusion MRI. Fig. 5.29 shows tracks which are the result of brain tractography.
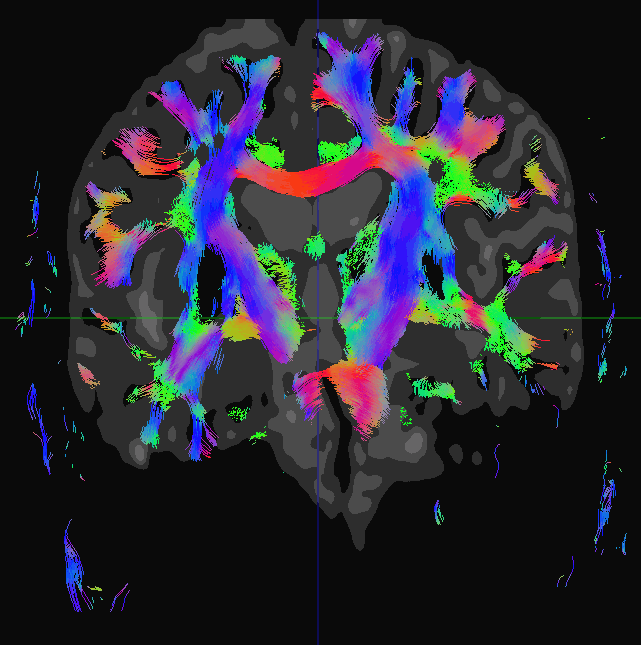
The tracks which are the result of tractography are refered to as fibers in the DICOM Viewer interface and in the User Manual.
5.22.1 Open series in DTI Mode
____________________________________________________________________________________________
Functionality is available in a separate module which is activated in the Pro edition for an extra fee
____________________________________________________________________________________________
The tractography will be performed automatically for the series made in the DTI mode when you open it in the MPR reconstruction or Volume reconstruction tabs. To display fibers over the images not made in the DTI mode (for the same study):
-
Open the series not made in the DTI mode.
-
Click the DTI
 button on the toolbar.
-
In the DTI Series dialog that appears, select the series made in the DTI mode.

The DTI Series window doesn’t show the current series, the DTI series added before, or the series that cannot be used for construction of a 3D model. -
Click SELECT to display fibers over the images or CANCEL to cancel.
-
To superimpose an image of fibers from another DTI series on an open series, repeat steps 2 — 4.
The images of fibers from each DTI series are added to the Fibers panel.
To delete an image of fibers contained in a superimposed DTI series, click the Remove DTI
series  button on the Fibers panel.
5.22.2 Opening a Fused Series in the DTI Mode
____________________________________________________________________________________________
Functionality is available in a separate module which is activated in the Pro edition for an extra fee
____________________________________________________________________________________________
An image of fibers can be superimposed on a fused series of one or several non-DTI studies. To do this, proceed as follows:
-
Open the fused series in the MPR reconstruction or Volume reconstruction tab (see Sections 4.1 and 4.2).
-
Open the segmentation panel by clicking the Segmented structure panel
 button.
-
Select one of the layers of the fused series on the segmentation panel.
-
Click the DTI
button on the toolbar.
-
In the DTI Series window that pops up, select a DTI series and click SELECT.
The DTI Series window doesn’t show the current series, the DTI series added before, other layers series, fused series, or the series that cannot be used for construction of a 3D model. -
For the second and subsequent layers, repeat steps 3 — 5.
The images of fibers from each DTI series are added to the Fibers panel.
To delete an image of fibers contained in a superimposed DTI series, click the Remove DTI
series button on the Fibers panel.
5.22.3 Fibers Panel
____________________________________________________________________________________________
Functionality is available in a separate module which is activated in the Pro edition for an extra fee
____________________________________________________________________________________________
To open the Fibers panel in the MPR reconstruction or Volume reconstruction tab, click
the Segmented structure panel button on the toolbar.
The Fibers panel for the MPR reconstruction tab is shown in Fig. 5.30, for the Volume reconstruction tab — in Fig. 5.31. On the panel for the Volume reconstruction tab, there are no ROI tools or their visualization elements.
The actions performed with groups of fibers are duplicated on the Fibers panel in the MPR reconstruction and Volume reconstruction tabs.
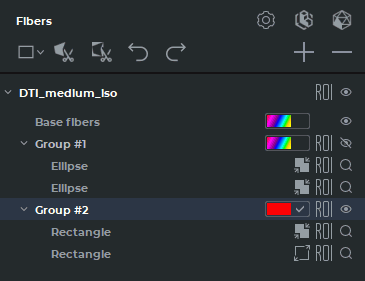
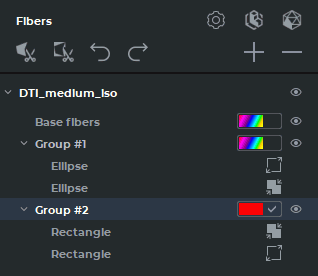
Tools and buttons on the Fibers panel:
 | ROI
...
tools
(Rectangle
,
Ellipse
 ,
Polygon
,
Polygon
 ).
The
shape
of
the
button
changes
depending
on
the
tool
chosen.
).
The
shape
of
the
button
changes
depending
on
the
tool
chosen. |
 | Polygon cut tool. |
 | Inverse polygon cut tool. |
 | The Undo cut button cancels the previous cutting operation. |
 | The Redo cut button repeats the last undone cutting operation. |
 | The New fibers group button adds a new group. |
| | The Remove fibers group/Remove ROI/Remove DTI series button deletes a selected group of fibers, a ROI within a group or a superimposed DTI series. |
 | The DTI parameters button calls up a dialog box to enable saving .spj files in the format compatible with the previous DICOM Viewer versions up to and including version 2.17 (see Section 5.22.9). |
 | The Voxelize tracks button is used to build a voxel model for the selected group of fibers (see Section 5.22.8). |
 | The Convert tracks to polygonal mesh button is used to build a polygonal surface for the selected group of fibers (see Section 5.22.7). |
5.22.4 Select Visible Fibers
____________________________________________________________________________________________
Functionality is available in a separate module which is activated in the Pro edition for an extra fee
____________________________________________________________________________________________
If you want to make only some fibers visible, specify the areas through which the fibers pass as visible or invisible. Use the ROI tools from the Fibers panel. The operation of these tools is similar to using ROI from the toolbar at the top of the window (see Section 2.19.7). Note that you cannot use the ROI tools from the top toolbar to adjust the visibility of the fibers.
To make some fibers visible:
-
Open the series made in the DTI mode or display fibers over the series not made in the DTI mode.
-
Select the plane and the image in which you want to specify the area through which the target fibers pass.
-
Open the Segmented Structure panel by clicking the Segmented structure panel
button. The Fibers panel will be located at the bottom.
-
Specify the desired area using the ROI tools (Rectangle
, Ellipse , Polygon
) on the Fibers panel. After making the ROI, only the fibers passing through the
region specified by the ROI will be visible. A new group appears on the Fibers panel.
This group includes the new ROI.
Each ROI tool can be activated with the left, right, or middle mouse button. To continue work with the same tool, use the button with which the tool was activated. For details on tool management, see Section 1.14.
-
If you want external fibers beyond a ROI to be visible, click the Set outer fibers
 button for this ROI. If you want internal fibers within a ROI to be visible, click the Set
inner fibers
button for this ROI. If you want internal fibers within a ROI to be visible, click the Set
inner fibers  button for this ROI.
-
Make new ROIs until you see only the target fibers. Only the fibers which pass through all the ROIs are visible (or invisible if you check the outer fibers box).
The Polygon cut and Inverse polygon cut tools can be used to edit groups of
fibers on orthogonal sections in the MPR reconstruction tab and on 3D models in the Volume
reconstruction tab. To open a series in the 3D view window, in the MPR reconstruction tab,
click 3D  button on the toolbar. The 3D view window that pops up will show the 3D model.
For details on customizing the section windows arrangement in the MPR reconstruction tab, see
Section 5.2.1.
button on the toolbar. The 3D view window that pops up will show the 3D model.
For details on customizing the section windows arrangement in the MPR reconstruction tab, see
Section 5.2.1.
To hide all the ROIs, click the Hide ROI  button in the line with the name of the series on
the Fibers panel. To show all the ROI, click the Show ROI
button in the line with the name of the series on
the Fibers panel. To show all the ROI, click the Show ROI  button. In the same way, you can
hide or display the ROI for each group or for a certain ROI within each group. The visibility of the
ROI does not affect the visibility of the fibers.
button. In the same way, you can
hide or display the ROI for each group or for a certain ROI within each group. The visibility of the
ROI does not affect the visibility of the fibers.
To hide fibers for the whole series, a Base fibers group, or a ROI group, click the Hide  button in the respective line. To show fibers, click the Show
  button. This button does not
affect the visibility of fibers, it only allows you to temporarily hide them, for example, to adjust the
visibility of other fiber groups.
button. This button does not
affect the visibility of fibers, it only allows you to temporarily hide them, for example, to adjust the
visibility of other fiber groups.
To rename a group or ROI, double-click the left mouse button on the group or ROI name, enter the new name, and press the Enter key on the keyboard.
To delete ROI select it and click the Remove fibers group/Remove ROI button on the
Fibers panel.
To make other fibers visible without changing the visibility of the fibers previously made visible:
-
If necessary, hide the previously displayed fibers by clicking the Hide
button in
the row with the fiber group name.
-
Show the base fibers by clicking the Show
button in the row with the Base fibers
group.
-
Add a new group by clicking the New fibers group
on the Fibers panel.
-
Add a new ROI to make only the target fibers visible. To ensure that the ROI is in the right group, this group must be selected before making a ROI.
-
If necessary, show some other fibers by clicking the Show
button in the rows with
their names.
To show the image containing a certain ROI, click the Find ROI  button on the Fibers
panel.
button on the Fibers
panel.
5.22.5 Fiber Color
____________________________________________________________________________________________
Functionality is available in a separate module which is activated in the Pro edition for an extra fee
____________________________________________________________________________________________
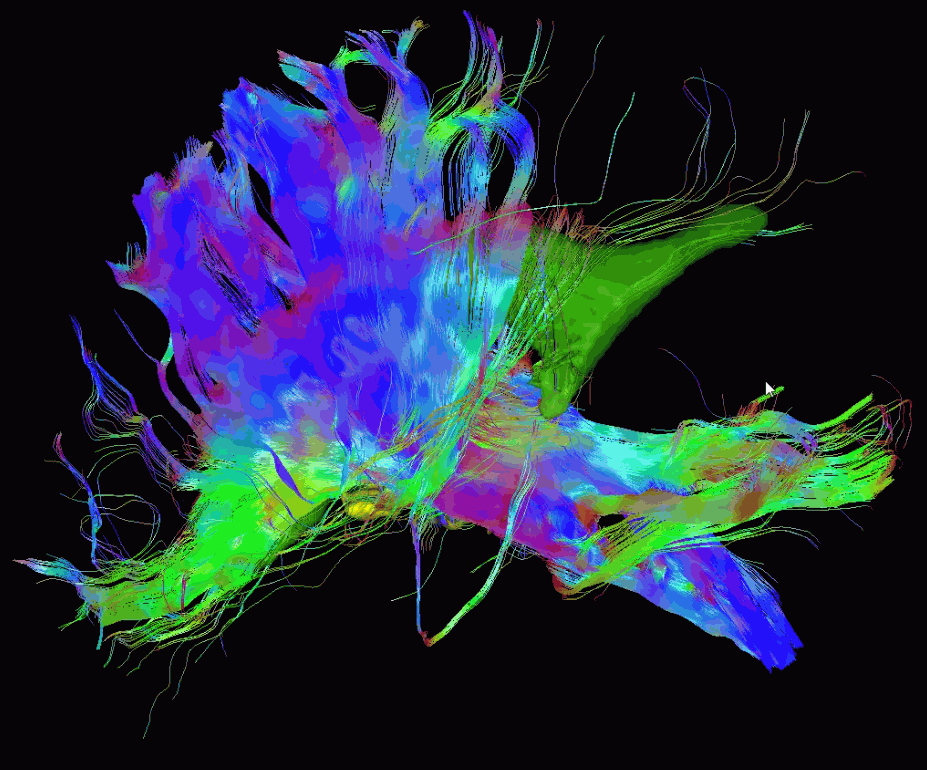
By default, fibers are colored in accordance with the DEC (Direction Encoded Color) scheme. It means that the color of a fiber depends on its direction. You can set color for each group manually.
On the Fibers panel, the button for selection of the color for a group of fibers is shown as a color
spectrum  in the DEC mode and as the selected color in the manual mode.
To choose the color for a selected group of fibers in the manual mode, check the box on the right-hand side of the color selection button. Then left-click on the color selection button and in the dialog box that pops up, select the color required or keep the default color.
To switch back to the DEC mode, uncheck the box on the right-hand side of the color selection button showing the selected color.
5.22.6 Scalar Maps
____________________________________________________________________________________________
Functionality is available in a separate module which is activated in the Pro edition for an extra fee
____________________________________________________________________________________________
| | The DTI maps panel is only shown in the MPR reconstruction tab. |
The DICOM Viewer allows to display scalar maps for series made in the DTI mode. The following types of maps are available:
-
Fractional Anisotropy (FA);
-
Mean Diffusivity (MD);
-
Axial Diffusivity (AD);
-
Radial Diffusivity (RD).
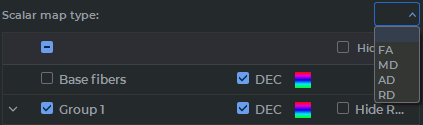
By default, the maps are not displayed. To display the map, select the target map on the drop-down list Scalar map type (Fig. 5.33). To hide the map, select an empty value from the list.
On the CLUT drop-down list, select the CLUT for the map spectrum. In the Value range fields, specify the minimum and the maximum values for the selected map visible range.
To restore the default range values for the selected map type, click the Restore default value
range  button on the maps panel. If the minimum and the maximum values for the visible
range of the selected map type are the same as the default values, the Restore default value range
button will be unavailable.
button on the maps panel. If the minimum and the maximum values for the visible
range of the selected map type are the same as the default values, the Restore default value range
button will be unavailable.
To minimize the maps panel, click the Collapse  button; to maximize the panel, click
Expand
button; to maximize the panel, click
Expand  .
.
There are three ways to measure intensity on scalar maps:
-
mouse over a selected point on the scalar map. The intensity value for the point indicated by the cursor is shown in the second line, in the bottom left corner of the viewer window where the cursor is placed. The intensity in the point indicated by the cursor is shown if the Show point value option has been activated (see Section 2.27);
-
measure the intensity value for a certain point on the scalar map with the Point value
 tool on the toolbar (see Section 2.19.6);
-
measure the average intensity value for a selected region on the scalar map with ROI ... tools (Rectangle
, Ellipse , Polygon ) on the toolbar (see
Section 2.19.7).
5.22.7 Building a Surface
____________________________________________________________________________________________
Functionality is available in a separate module which is activated in the Pro edition for an extra fee
____________________________________________________________________________________________
DICOM Viewer allows for building fiber surfaces in the Multiplanar reconstruction window.
Select a group of fibers or a ROI for the selected group of fibers. A polygon surface is built for a group of fibers. If you change the ROI visibility for the group of fibers, it won’t have any impact on the surface to be built.
Each fiber is represented by a volumetric figure. The polygonal surface is constructed based on the fiber’s diameter and the number of points on its contour.
To set the parameters for the surface model surface, click the button Convert tracks to
polygonal mesh on the Fibers panel. In the dialog box for the surface model parameters
(Figure 5.34), provide the following parameters:
-
Fiber contour points, from 3 to 360. In most cases, six points are enough to ensure decent accuracy. The accuracy of the model, the time required for estimation and the memory space required increases with the number of points on the contour.
-
Fiber diameter, from 0.01 to 10 mm.
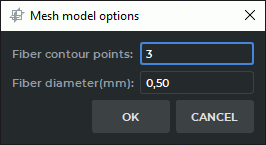
Click OK to apply the settings or CANCEL to cancel.
A surface is created for the chosen group of fibers and added to the list on the Segmented structure panel. The name of the surface, as well as the name of any structure without a volume model, is shown in italics. The name of the surface is copied from the name of the group on the Fibers panel.
You can view the built surface in the MPR reconstruction tab. To open a volume
reconstruction, click the 3D button on the toolbar.
The 3D model will be shown in the 3D view window that pops up. For details on customizing the section windows arrangement in the MPR reconstruction tab, see Section 5.2.1.
The work with the structures from the segmented structure list is described in Section 6.4. The surfaces created can be exported or imported. For details on surface and structure export and import, see Section 6.7. The procedures of saving and opening segmentation projects and DTI projects are described in Section 6.11.
5.22.8 Creating a Voxel Model of Fibers
____________________________________________________________________________________________
Functionality is available in a separate module which is activated in the Pro edition for an extra fee
____________________________________________________________________________________________
DICOM Viewer allows for building voxel models of fibers in the Multiplanar reconstruction tab.
Select a group of fibers or a ROI for the selected group of fibers. A voxel model is built for a group of fibers. If you change the ROI visibility for the group of fibers, it won’t have any impact on the model to be built.
To build a voxel model, click the Voxelize tracks button on the Fibers panel.
A voxel model is created for the chosen group of fibers and added to the list on the Segmented structure panel. The name of the structure is copied from the name of the group on the Fibers panel.
To create a voxel model based on all the fibers, select the Base fibers group and click the
Voxelize tracks button on the Fibers panel.
The voxel model is created for the chosen group of fibers (Base fibers) and added to the list on the Segmented structure panel under the name DTI tracktography.
You can view the model built in the MPR reconstruction tab. To open a volume
reconstruction, click the 3D button on the toolbar.
The 3D model will be shown in the 3D view window that pops up. For details on customizing the section windows arrangement in the MPR reconstruction tab, see Section 5.2.1.
The work with the structures from the segmented structure list is described in Section 6.4. The surfaces created can be exported or imported. For details on structure export and import, see Section 6.7. The procedures of saving and opening segmentation projects and DTI projects are described in Section 6.11.
5.22.9 Saving data in a file
____________________________________________________________________________________________
Functionality is available in a separate module which is activated in the Pro edition for an extra fee
____________________________________________________________________________________________
The DICOM Viewer provides an opportunity to save ROI and groups in files with .spj extension. The procedure for saving and opening files is described in Section 6.11. When a file is opened, the data contained in it is added to the data from the Fibers panel.
To save an .spj file in a format compatible with the previous DICOM Viewer Viewer versions (up
to and including version 2.17), click the DTI parameters button on the Fibers panel. In the
dialog box that pops up, enable the option Save the DTI fibers data in a format compatible
with legacy versions of the viewer. Click OK to apply the settings or CANCEL to
cancel.