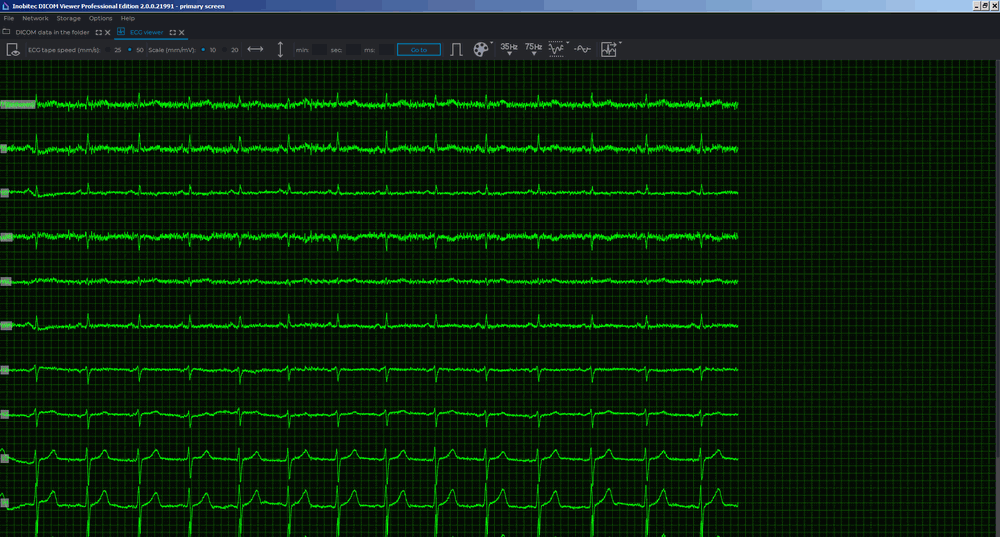
11.4. Toolbar
The toolbar is at the top of the tab (Fig. 11.3).

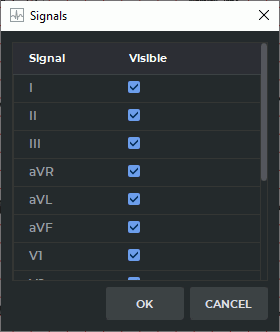
11.4.1 Select Lead
To select the ECG leads to be displayed:
-
Click the Set visible leads
 button on the toolbar. The window shown in Fig. 11.4
will be displayed.
button on the toolbar. The window shown in Fig. 11.4
will be displayed.
-
Check the leads to be displayed. By default, all the leads are displayed.
-
Click OK to apply the settings or CANCEL to cancel the actions.
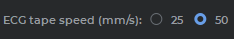
11.4.2 ECG Speed
Two speed values are available: 25 and 50 millimeters per second. The default speed is 50 millimeters per second. The required value is set using a switch (Fig. 11.5).
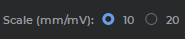
11.4.3 Scale
Two scale values are available: 10 and 20 millimeters per millivolt. The default scale is 10 millimeters per millivolt. The required value is set using a switch (Fig. 11.6).
11.4.4 Length Interval
To select a length interval:
-
Activate the Interval
 tool on the toolbar.
-
Move the mouse along the graph to find the point to start with (it does not matter if the point is located on the left or on the right).
-
Click any mouse button to fix the point.
-
Move the mouse along the graph to locate the second point. The interval length value will be displayed against the interval background.
-
Click any mouse button to fix the point.
To move the interval, locate the cursor on it and drag it holding down the left mouse button or the button to which this tool is assigned.
Only one interval can be built at a time.
To delete the interval, deactivate the Interval tool.
11.4.5 Value Interval
To select a value interval:
-
Activate the Values Interval
 tool on the toolbar.
-
Move the mouse over the graph to locate the point to start with (it does not matter if the point is located at the top or at the bottom).
-
Click any mouse button to fix the point.
-
Move the mouse over the graph to locate the second point. The value matching the interval will be displayed against the interval background.
-
Click any mouse button to fix the point.
 | The units of measure of a value interval for an ECG series are determined automatically on the basis of the DICOM tags for the series. If the required data are missing, the value of the selected interval is not displayed. |
To move the interval, locate the cursor on it and drag it, holding down the left mouse button or the button to which this tool is assigned.
Only one interval can be built at a time.
To delete the interval, deactivate the Values Interval tool.
11.4.6 Move to a Time Point on the Graph
To move to a particular time point on the graph, enter the values (minutes, seconds and milliseconds) into the corresponding areas on the toolbar (Fig. 11.7) and click the GO TO button. The graph will move to display its part starting from the specified time. You can drag the graph with the mouse at any time.
If the entered time value exceeds the study duration, the graph will be out of vision. Enter a new value or move the graph manually.
If some parameter has a zero value, it does not need to be entered. For instance, to move to the time point 1 minute 110 milliseconds, enter the values as shown in Fig. 11.7.

11.4.7 Set Up Coordinate Plane
To display the scale on the coordinate plane, activate the Scale ECG  tool on the toolbar (by
default it is inactive). To hide the scale line, click the button again.
tool on the toolbar (by
default it is inactive). To hide the scale line, click the button again.
| | The ECG scale is determined automatically on the basis of the DICOM tags for the series. If the required data are missing, the scale line is not displayed. |
To change the color scheme, click the Choose color scheme  button on the toolbar. Two
color scheme options are available: classic (set by default) and green (Fig. 11.8).
button on the toolbar. Two
color scheme options are available: classic (set by default) and green (Fig. 11.8).