2.25. Calcium Scoring
____________________________________________________________________________________________
Functionality is available in the Pro edition
____________________________________________________________________________________________
The DICOM Viewer allows you to measure calcium in the coronary arteries using the Calcium scoring tool. The conditions on which the tool is available are listed below:
-
the series modality is CT;
-
the series contains information on the slices thickness;
-
slices must be shown in the axial projection (see Section 2.13).
If a series does not meet these requirements, the Calcium scoring tool will not be available.
The tool selection button will look different depending on the tool that was used last:
 | Calcium scoring (ellipse) (selected by default) |
 | Calcium scoring (polygon) |
To switch between these tools click the arrow on the tool selection button and select the desired tool.
2.25.1 Selection of measurement areas
____________________________________________________________________________________________
Functionality is available in the Pro edition
____________________________________________________________________________________________
To measure calcium:
-
Open a CT series suitable for activation of the calcium measurement tool (see Section 2.25). Change the series view projection to axial if necessary (see Section 2.13).
-
Select the image to measure.
-
Activate the
Calcium scoring (ellipse) tool or Calcium scoring
(polygon). These tools are similar to ROI ellipse and ROI polygon (see
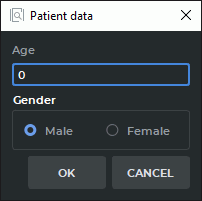
Section 2.19.7). If the study does not contain information about the age and/or gender
of the patient, the dialog shown in Fig. 2.81 appears. Enter missing information and click
OK to continue or CANCEL to cancel the measurement. After clicking OK, this dialog
no longer appears until the Flat image viewer window is closed. To change the gender
and/or age of the patient, close the Flat Images View window and return to step 1.
-
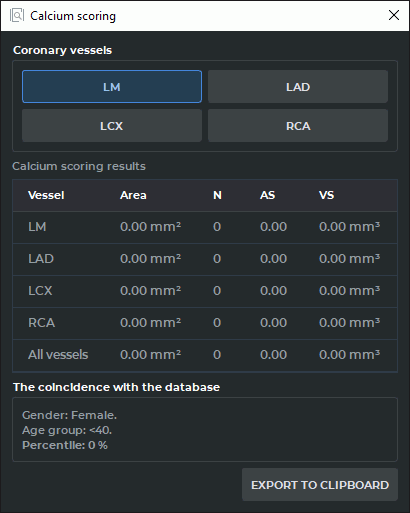
When the calcium scoring tool is active, a window shown in Fig. 2.82 is displayed on the screen. Move the window if necessary. To do this, move the cursor over the window title (highlighted in red in the figure) and move it, holding the left mouse button. In the upper part of the window there are vessel selection buttons:
-
LM — Left main coronary artery
-
LAD — Left anterior descending coronary artery
-
LCX — Left circumflex coronary artery
-
RCA — Right coronary artery
Select the artery for measurement by clicking the corresponding button. The choice of an artery does not affect the measurement result.
-
-
Build an ellipse or a polygon around the affected area. For details on how to build one, see Section 2.19.7 (the ROI ellipse and ROI polygon tools). A block with the following data is displayed near the measurement:
-
The name of the artery (corresponds to the button pressed while building);
-
Area of calcified lesion. If the measurement area contains several lesions then their total area is displayed;
-
Agatston score;
-
Volume score.
-
 | When the projection is switched from axial to any other, the tool is deactivated. |
To deactivate the tool click the tool selection button Calcium scoring (ellipse) tool or
Calcium scoring (polygon) or close the Calcium scoring window. All the changes made are
saved until the Flat images view window is closed.
2.25.2 Actions with measurement areas
____________________________________________________________________________________________
Functionality is available in the Pro edition
____________________________________________________________________________________________
For details on how to move measurement areas, see Section 2.19.11, for how to move measurement results, see Section 2.19.12.
To edit the drawing parameters:
-
Activale the calcium scoring tool.
-
Locate the cursor on the measurement or the mesurement results to highlight them.
-
Right-click the mouse and select the Tool options... item from the context menu.
-
In the dialog box that appears, enter the measurement name.
-
Set the color by clicking on the color box.
-
Set the line thickness and the font size.
-
To connect the block with the measurement results with a dotted line, the Footnote line box must be checked.
-
To display the block with the measurement results, the Show labels box must be checked.
-
To use these parameters by default, check the box Set as default.
-
To apply the settings, click OK. To cancel, click CANCEL.
2.25.3 Measurement results
____________________________________________________________________________________________
Functionality is available in the Pro edition
____________________________________________________________________________________________
The measurement results are displayed in the window shown in Fig. 2.82:
-
For each vessel separately and in total:
-
total lesion area (for all lesions);
-
lesion numder (N);
-
Agatston score (AS);
-
Volume score (VS).
-
-
Patient gender
-
Age group
-
Percentile
Formula for Agatston index scoring:
| (2.23) |

Ics — Agatston index, n — lesion number, Si — i-lesion area, Fi — i-lesion density factor, Tslice — slice thickness. The Fi value is determined by the maximum pixel density in the lesion area:
| Maximum pixel density | Fi |
| 130—199 HU | 1 |
| 200—299 HU | 2 |
| 300—399 HU | 3 |
| ≥ 400 HU | 4 |
Formula for calcium scoring:
| (2.24) |
V cs — Agatston index, n — lesion number, Si — i-lesion area, Tslice — slice thickness.
Electron beam tomographic coronary artery calcium score percentiles for men and Women within each age strata
| <40 | 40-44 | 45-49 | 50-54 | 55-59 | 60-64 | 65-69 | 70-74 | >74 | |
| Man (25251) | 3504 | 4238 | 4940 | 4825 | 3472 | 2288 | 1209 | 540 | 235 |
| 25th percentile | 0 | 0 | 0 | 1 | 4 | 13 | 32 | 64 | 166 |
| 50th percentile | 1 | 1 | 3 | 15 | 48 | 113 | 180 | 310 | 473 |
| 75th percentile | 3 | 9 | 36 | 103 | 215 | 410 | 566 | 892 | 1071 |
| 90th percentile | 14 | 59 | 154 | 332 | 554 | 994 | 1299 | 1774 | 1982 |
| Woman (9995) | 641 | 1024 | 1634 | 2184 | 1835 | 1334 | 731 | 438 | 174 |
| 25th percentile | 0 | 0 | 0 | 0 | 0 | 0 | 1 | 3 | 9 |
| 50th percentile | 0 | 0 | 0 | 0 | 1 | 3 | 24 | 52 | 75 |
| 75th percentile | 1 | 1 | 2 | 4 | 23 | 57 | 145 | 210 | 241 |
| 90th percentile | 3 | 4 | 2 | 55 | 121 | 193 | 410 | 631 | 709 |
The measurement results are exported in the html format can be inserted into report editor (see Chapter 18) or in a text editors that support the html markup, for example, LibreOffice Writer or Microsoft Word. To do this click the EXPORT TO CLIPBOARD button, create a document in a text editor and paste the copied information into it.