2.23. Visualize Images
2.23.1 Select CLUT
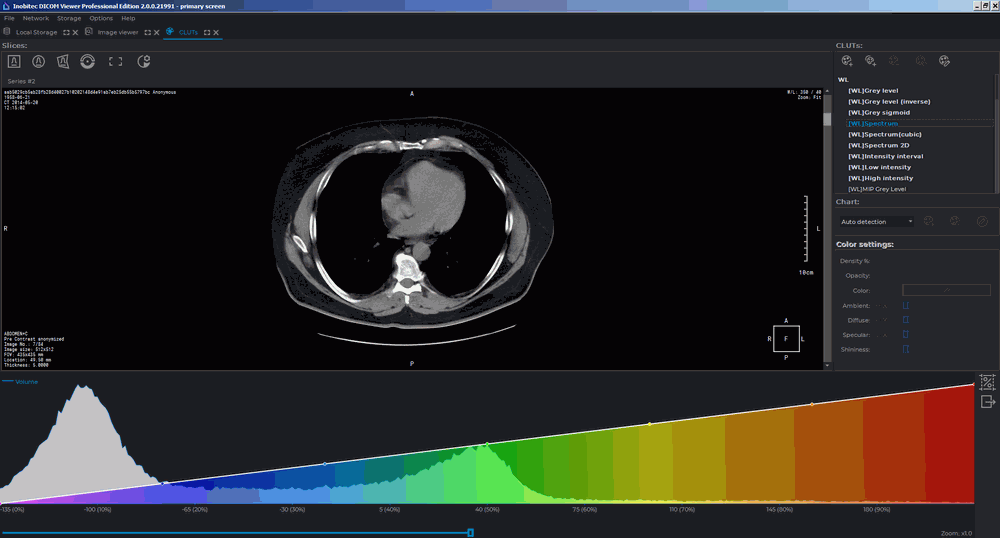
Select the CLUT (colour look-up table) from the drop-down menu on the rendering setup panel (Fig. 2.69).

You can choose from the following groups of CLUTs:
-
relative [WL];
-
absolute CT and XA;
-
special, Palette color. This type of CLUT is used for adequate display of the images belonging to series where there is at least one image with the Photometric Interpretation (0028,0004) tag value equal to PALETTE COLOR.
If, when a series is opened, the first image displayed has the Photometric Interpretation (0028,0004) tag value equal to PALETTE COLOR, the Palette color CLUT will be automatically selected. If the first image displayed has a different Photometric Interpretation (0028,0004) tag value, the relative [WL] CLUT will be selected for the group. In this case, you will have to select the Palette color CLUT manually to view the images with the PALETTE COLOR value of the Photometric Interpretation (0028,0004) tag.
When the Palette color CLUT is used, the Custom W/L  button is unavailable.
2.23.2 Edit CLUTs List
To edit the list, open the CLUTs setup tab by clicking the CLUTs  button. The tab is shown in
Fig. 2.70.
button. The tab is shown in
Fig. 2.70.
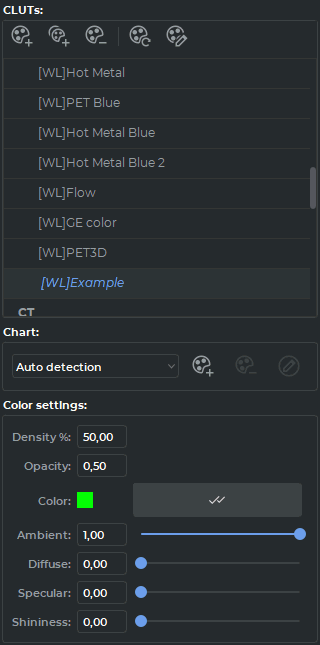
CLUTs setup panel is located on the right-hand side of the window (Fig. 2.71).
The CLUTs list edit buttons are located at the top of the panel.
 | Add a new CLUT as a copy of the current one adds a new CLUT as a copy of the selected one |
 | Add a new group adds a new group of CLUTs |
 | Remove the selected CLUT/group deletes the selected CLUT or group. Predefined groups and some CLUTs cannot be deleted |
 | Reset the selected CLUT to its original state sets up default parameters for the selected CLUT |
 | Edit CLUT/group opens the CLUT or group setup dialog |
The groups contain several CLUTs (e.g., WL, CT, XA) and are intended for structuring the list. They are marked by the arrow (Fig. 2.72) on the drop-down menu (Fig. 2.69). For the description of the process of assigning the group type to the user CLUTs, see Section 2.23.4.

To add a new group, set the following parameters in the dialog box (Fig. 2.73):
-
Name: any name of group;
-
Required tags: labels that must contain CLUTs to be included in the group.
2.23.3 CLUT Parameters
To browse the settings for the selected CLUT, click the Rendering transfer function ![]() button. The panel displaying the visualization transfer function graph will appear at the bottom of
the study window (see the example in Fig. 2.74).
button. The panel displaying the visualization transfer function graph will appear at the bottom of
the study window (see the example in Fig. 2.74).
You cannot change the setup parameters for predefined CLUTs.
Intensity will be displayed on the horizontal axis, while the number of points with a particular intensity will be shown on the vertical axis (blue line). The default scale may not allow you to see the intensity distribution graph (blue) at once. To change the horizontal axis scale, move the scroll under the axis or roll the mouse wheel while the cursor is located on the scrollbar. The scale value will be displayed to the right of the scrollbar. To change the vertical axis scale, roll the mouse wheel while the cursor is located on the visualization setup panel, but not on the scrollbar. Fig. 2.75 shows the same graph as in the previous figure, but with a greater intensity distribution scale (on the vertical axis).
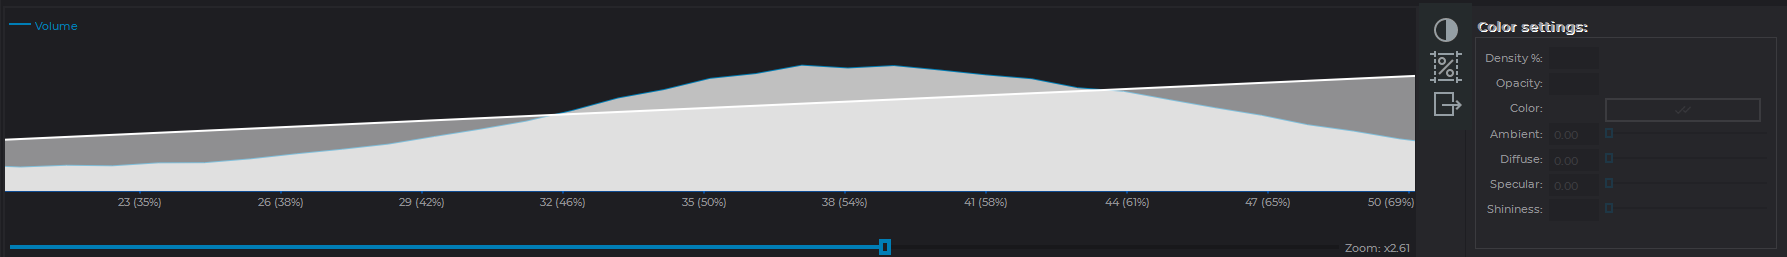
The color/transparency chart (white line) is superimposed on the intensity distribution scale. The horizontal axis shows the intensity, and the vertical axis shows the transparency of the color highlighting the points with this intensity. The color is displayed below the graph. The horizontal axis scale changes for both graphs simultaneously, while the vertical axis scale for the color/transparency chart does not change. To move the graph along the horizontal axis, hold the left mouse button.
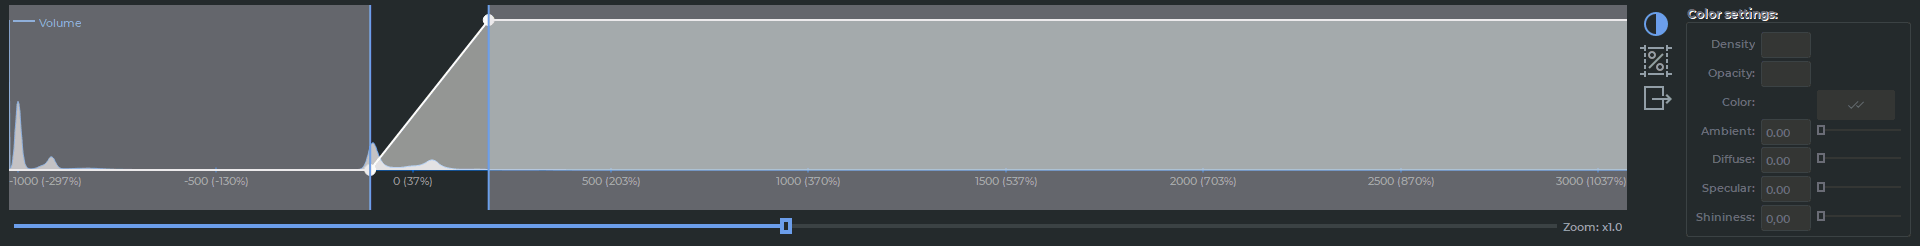
To show the current edges of the window level and width (W/L) in the histogram window, click
the  Adjust W/L button on the rendering transfer function panel. This mode is switched on
by default. The current edges of the window level and width are displayed as blue vertical lines in the
histogram window (Fig. 2.23.3).
Adjust W/L button on the rendering transfer function panel. This mode is switched on
by default. The current edges of the window level and width are displayed as blue vertical lines in the
histogram window (Fig. 2.23.3).
The DICOM Viewer provides an opportunity to adjust the edges of the window level and width in
the histogram window. To do it, mouse over one of the edges so that the cursor is displayed as  .
Move the edge while holding the left mouse button. On the flat image viewer tab, the edges
of the window level and width are only displayed for relative CLUTs (the CLUTs with
the [WL] group label). If the CLUT selected on the Image viewer tab is absolute (and
has a CT group label), the edges of the window level and width will not be shown in
the histogram. The Adjust W/L button on the rendering transfer function panel
will be disabled. On the MPR reconstruction and Volume reconstruction tabs, the
edges of the window level and width will be shown in the histogram for all the types of
CLUTs.
.
Move the edge while holding the left mouse button. On the flat image viewer tab, the edges
of the window level and width are only displayed for relative CLUTs (the CLUTs with
the [WL] group label). If the CLUT selected on the Image viewer tab is absolute (and
has a CT group label), the edges of the window level and width will not be shown in
the histogram. The Adjust W/L button on the rendering transfer function panel
will be disabled. On the MPR reconstruction and Volume reconstruction tabs, the
edges of the window level and width will be shown in the histogram for all the types of
CLUTs.
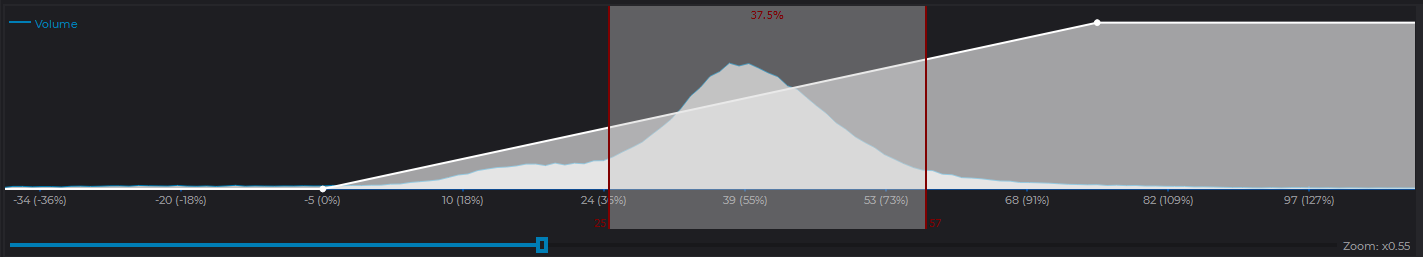
To find out what percentage of tissue has a density in a given range, click on the Histogram
percentage  button, move the cursor to the beginning of the range and move the cursor to the
end of the range, holding the left mouse button. The percentage of tissue that has a density within
the range is indicated in red (Fig. 2.77). To edit a range, move the cursor to its border and move the
border with the left mouse button pressed. To move a range, move the cursor on it so that the cursor
would look as follows
button, move the cursor to the beginning of the range and move the cursor to the
end of the range, holding the left mouse button. The percentage of tissue that has a density within
the range is indicated in red (Fig. 2.77). To edit a range, move the cursor to its border and move the
border with the left mouse button pressed. To move a range, move the cursor on it so that the cursor
would look as follows  , and move the cursor, holding the left mouse button. Multiple ranges can
be built at the same time. To remove the built ranges, click the Histogram percentage button
again.
, and move the cursor, holding the left mouse button. Multiple ranges can
be built at the same time. To remove the built ranges, click the Histogram percentage button
again.
To export data on the distribution of densities, click on the  button, in the dialog that
opens, specify the file name and folder, click Save to finish or Cancel for cancel.
button, in the dialog that
opens, specify the file name and folder, click Save to finish or Cancel for cancel.
2.23.4 Create and Edit CLUT
To create your own CLUT:
-
Click the CLUTs
button to open the CLUT setup tab.
-
Copy one of the existing CLUTs by selecting it from the list and clicking on the Add a new CLUT as a copy of the current one
button.
-
To rename a CLUT, double-click the left mouse button on it, enter the new name and press the Enter key on the keyboard. In our example, in Figure 2.71, the table is renamed "[WL]Example".
-
Specify the required parameters:
-
Color. Select a point on the color/transparency chart. The color settings for this point will become available. To set the color of the current point for all the points of the chart, click the Apply to all chart points
 button.
-
Density. Sets the position of the point on the horizontal axis. The alternative way to set this parameter is to move the point along the horizontal axis using the mouse.
-
Opacity. Sets the opacity of the color. 1 — maximum, 0 — minimum. The alternative way to set this parameter is to move the point along the vertical axis using the mouse.
-
-
To add a point, locate the cursor on the graph so that it looks like
 , right-click the mouse
and select the Add point item.
, right-click the mouse
and select the Add point item.
-
To delete a point, locate the cursor on the point so that it looks like
, right-click the
mouse and select the Remove point item.
-
To restore the original settings for this CLUT, click the Reset the selected CLUT to its original state
button.
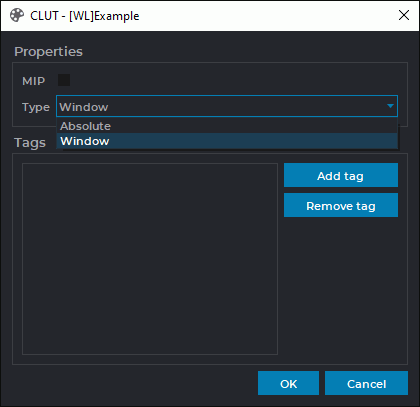
-
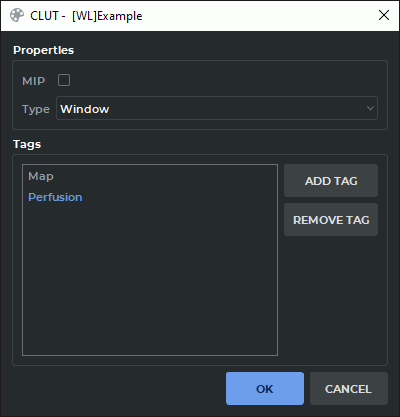
To assign a group type to the CLUT, click the Edit CLUT/group
button at the top of
the CLUTs settings panel. In the CLUT dialog box (Fig. 2.78), select the group type to which
the table belongs from the drop-down list:
-
Window, if the CLUT is relative and has a group label [WL];
-
Absolute, if the CLUT is absolute and has a group label CT and XA.
Click OK to apply the settings or CANCEL to cancel.
-
-
To add the tags that the CLUT should contain, click the Edit CLUT/group
button at
the top of the CLUTs panel. In the CLUT dialog box (Fig. 2.78), click the ADD TAG button
and enter the tag name in the input area. To rename a tag, double-click on the tag name, enter
the new name and press the Enter key on your keyboard. To remove a tag, select it and click
the REMOVE TAG button.
Click OK to apply the settings or CANCEL to cancel.
To delete a CLUT, click the Remove the selected CLUT/group button.
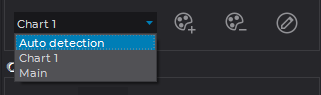
The DICOM Viewer allows you to add additional color/transparency charts. To add:
-
Click the Add chart
button. A new chart will appear at the bottom part of the
window, and its name will be added to the drop-down chart menu. The opened menu is
shown in Fig. 2.79.
-
To rename the selected chart, click the Edit chart name
 button, type new name
and press Enter key on the keyboard.
button, type new name
and press Enter key on the keyboard.
-
To delete the selected chart, click the Remove chart
button.
-
To move all the charts along the horizontal axis, locate the cursor so that it would not to be on any chart and move it, holding the left mouse button.
-
To move any chart, select Auto detection from the drop-down chart menu, locate the cursor on the some chart and move it, holding the left mouse button.
-
To move a certain chart, select its name from the drop-down chart menu, locate the cursor on this chart and move it holdind the left mouse button. This mode is useful if the charts overlap.
If the charts overlap, the colors are mixed.
2.23.5 User CLUTs Import
User CLUTs may be imported from one of the program versions to another. This function provides an opportunity to use the CLUTs created by another user or in another DICOM Viewer version. For details, see the Section 16.9.3.