7.7. Vessel Analysis Mode
____________________________________________________________________________________________
Functionality is available in a separate module which is activated in the Pro edition for an extra fee
____________________________________________________________________________________________
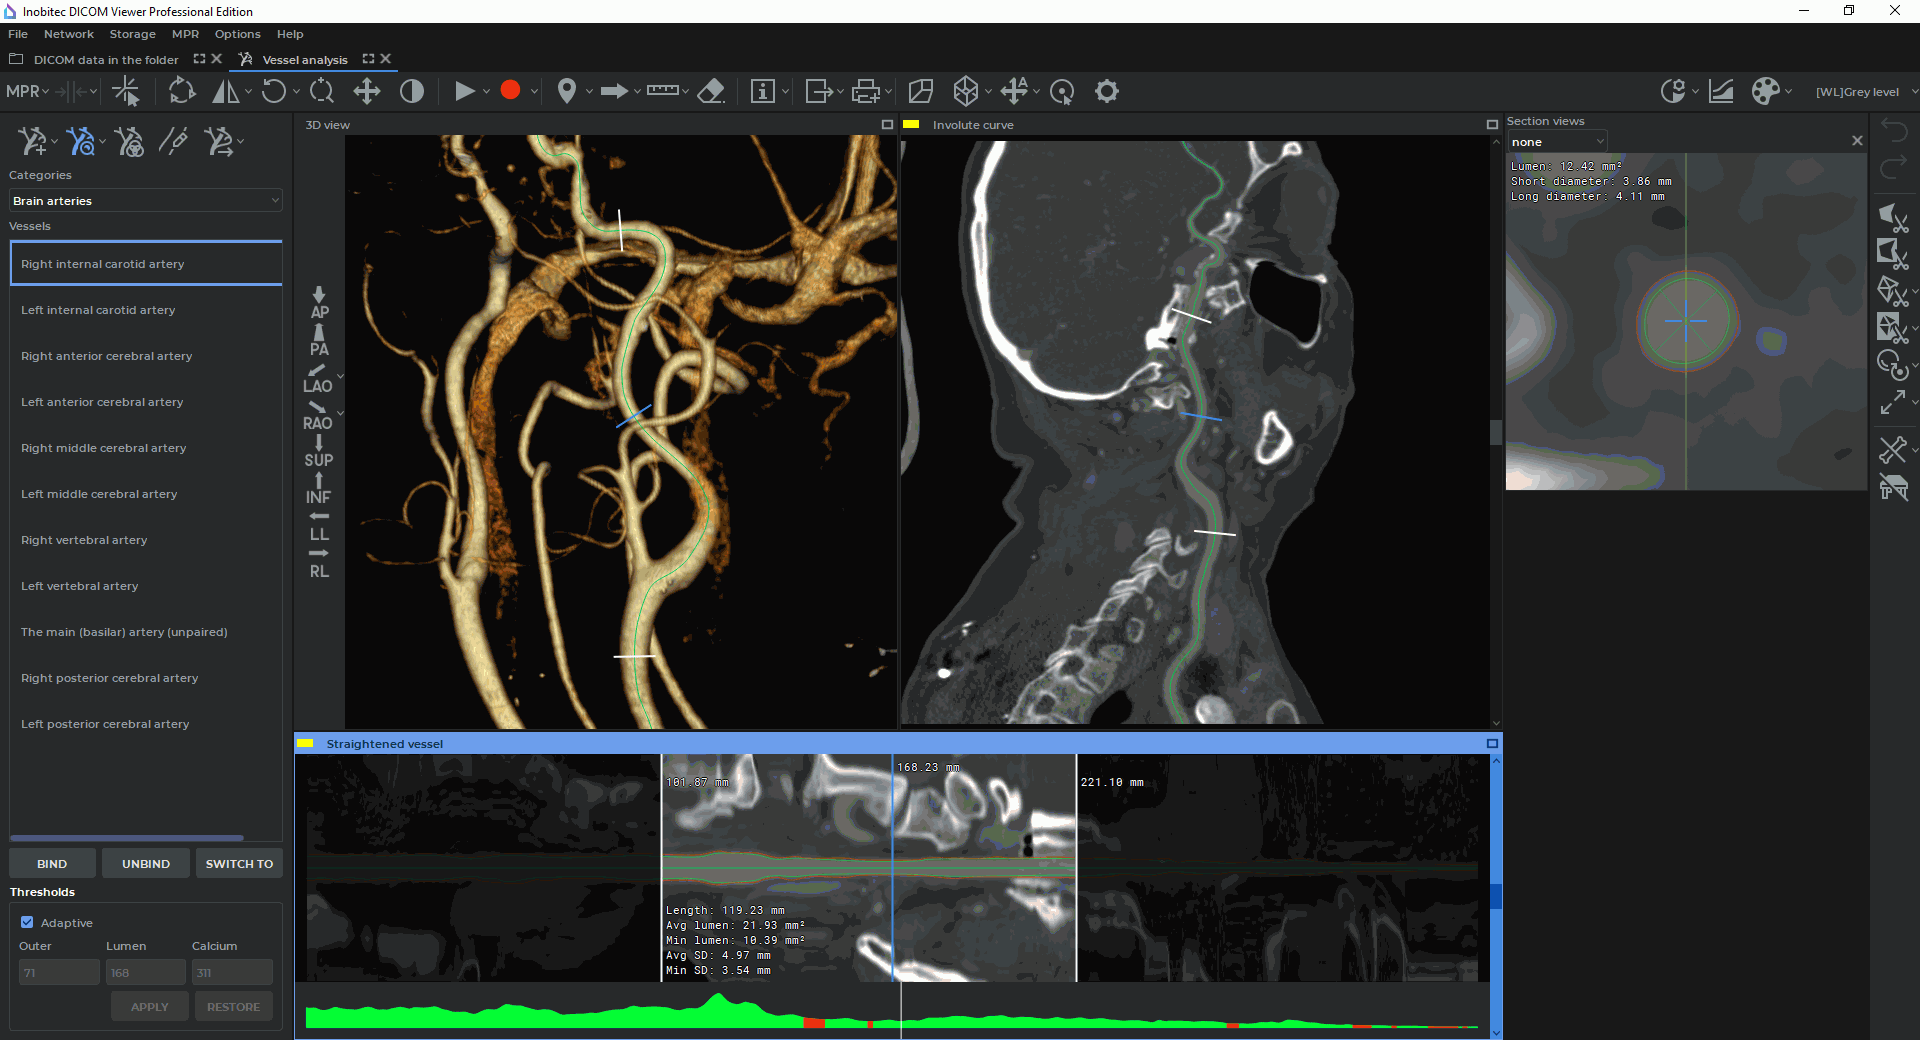
After building the necessary centerlines, switch to the Vessel analysis mode by clicking on
the Analysis mode  button. The window in the Vessel analysis mode is shown in
Fig. 7.7.
button. The window in the Vessel analysis mode is shown in
Fig. 7.7.
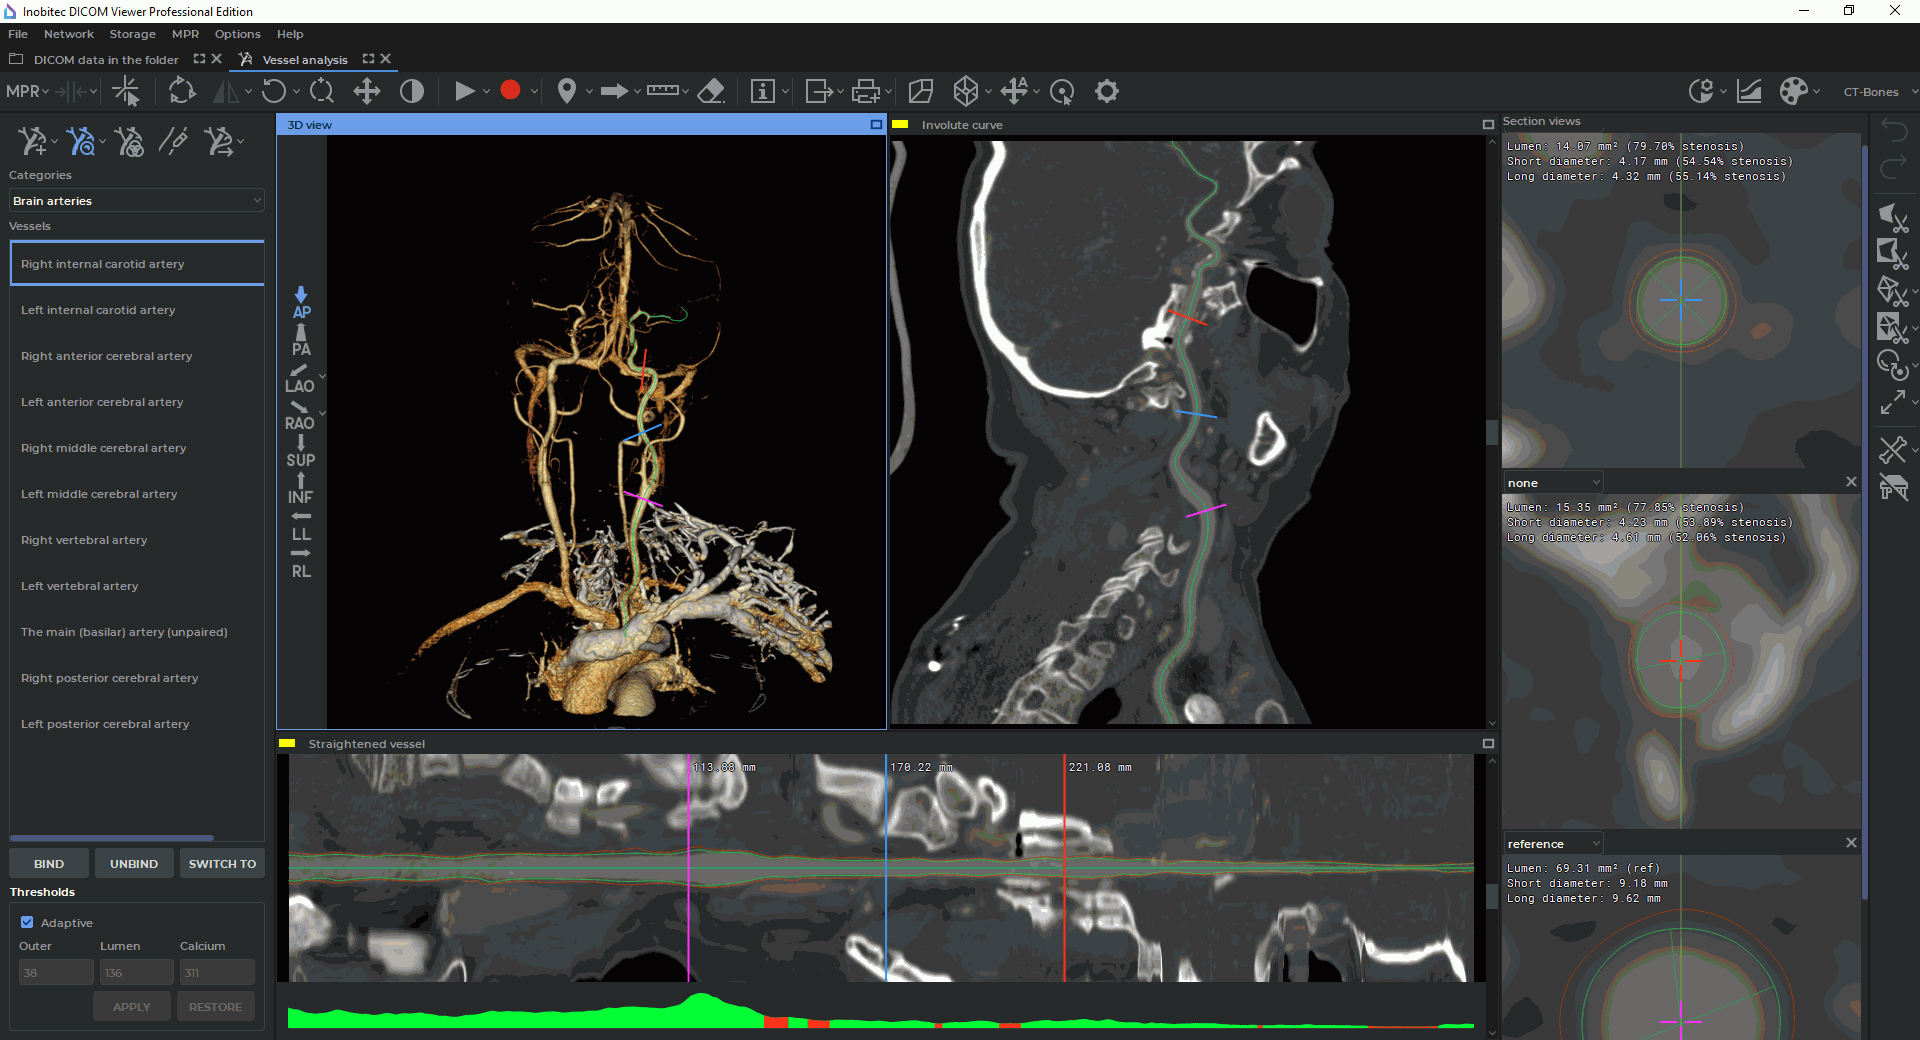
The volume reconstruction is shown in the 3D view window, the curved surface is shown in the Involute curve window. The vessel sweep following the straightening of its centerline and the marking of its borders is shown in the Straightened vessel window. The sections by the planes that are perpendicular to the centerline are shown in the Section window.
You cannot edit the centerline in the Vessel analysis mode. To do it swith to Centerline building
mode by clicking the Analysis mode button.
7.7.1 Vessel borders
____________________________________________________________________________________________
Functionality is available in a separate module which is activated in the Pro edition for an extra fee
____________________________________________________________________________________________
The DICOM Viewer calculates the inner and outer borders of a vessel and the border of calcifications inside a vessel (Fig. 7.9). If no calcifications are found, then the corresponding value remains empty.
If the Adaptive box is checked, threshold density values will be evaluated for each vessel section individually. This ensures more accurate display of contours of vessels and calcifications. The box is checked by default.
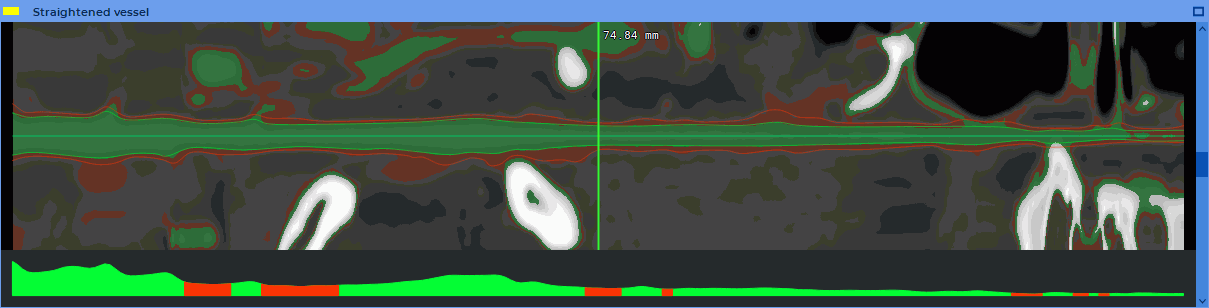
To see the tissues that correspond to the density ranges, click the Show vessel tissue  button. In the Section views window the tissues with an intensity between the inner border and the
calcium border (vessel lumen) are highlighted in green, the tissues with an intensity between the outer
and inner border (vessel wall) are highlighted in brown, and the tissues with an intensity higher than
the calcium border (calcifications) are highlighted in white. The borders of the vessel are
built in accordance with the threshold values, but due to certain smoothing they do not
exactly correspond to the threshold values. In the Straightened vessel window, the
green line indicates the inner border of the vessel, the red line indicates the outer border
(Fig. 7.10).
button. In the Section views window the tissues with an intensity between the inner border and the
calcium border (vessel lumen) are highlighted in green, the tissues with an intensity between the outer
and inner border (vessel wall) are highlighted in brown, and the tissues with an intensity higher than
the calcium border (calcifications) are highlighted in white. The borders of the vessel are
built in accordance with the threshold values, but due to certain smoothing they do not
exactly correspond to the threshold values. In the Straightened vessel window, the
green line indicates the inner border of the vessel, the red line indicates the outer border
(Fig. 7.10).
If the Adaptive box is checked on the threshold value panel, then threshold density values are only highlighted in the Section views window as in this case threshold density values are evaluated for each vessel section individually. If the Adaptive box is unchecked, threshold density values are also highlighted in the Straightened vessel window.
The central line is shown as a straight line.
To edit borders, activate the  Edit vessel contours tool, click the left mouse button at an
arbitrary place near the border, the border will pass through the selected point. When
you move the mouse while holding the left button, the border repeats the path of the
cursor.
Edit vessel contours tool, click the left mouse button at an
arbitrary place near the border, the border will pass through the selected point. When
you move the mouse while holding the left button, the border repeats the path of the
cursor.
 | You need to control the process of boundaries creation, as well as the threshold boundary and calcification values. If needed, change the boundaries and the threshold values manually. |
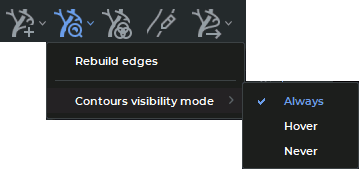
To choose a visibility mode for vessel contours, press the arrow on the Analysis mode button
and select the Contours visibility mode command (Fig. 7.8). The same command is
available in the right-click menu if the vessel analysis mode is active. The current contours visibility
mode is ticked.
-
Always. Vessel contours are constantly displayed in Section views and Straightened Vessel windows. The mode is selected by default.
-
Hover. Vessel contours are displayed in Section views and Straightened Vessel windows when the user hovers over the contours.
-
Never. Vessel contours are not displayed in any windows of the tab.
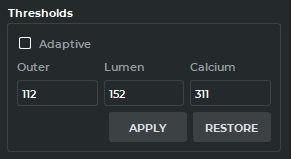
To change the threshold values, uncheck the Adaptive box and enter new values in the appropriate fields and click the APPLY button. The border will be rebuilt in accordance with the new values. To return to the threshold values calculated automatically, click the RESTORE button.
To undo the all changes and return to the initial borders, click on the arrow on the Analysis
mode button button and select the Rebuild edges command.
At the bottom of the Straightened Vessel window, there is a graph showing changes in the vessel lumen. The areas in which stenosis is possible are highlighted in red on the graph, the remaining sections are highlighted in green.
7.7.2 Section analysis
____________________________________________________________________________________________
Functionality is available in a separate module which is activated in the Pro edition for an extra fee
____________________________________________________________________________________________
To add a section, move the cursor to the centerline in the Involute curve, Straightened vessel or 3D view window, right-click and select the Add section command or Add reference to add a reference section.
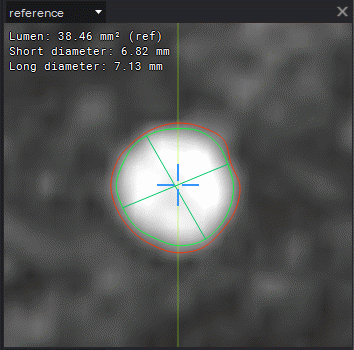
To delete a section, select the Remove section command on the context menu of the section or click on the cross in the upper right-hand corner of the current section window (Fig. 7.11).
The position of the cross on the section corresponds to the position of the centerline.
The borders are outlined by the green and red lines. When editing borders in the current section
window (Fig. 7.11), the Edit vessel contours tool can be deactivated.
The yellow line in the current section window shows the cutting plane for the current section shown in the Straightened vessel window. To rotate the cutting plane, move the cursor over it so that a bidirectional arrow appears, hold the left mouse button and move the mouse.
The following parameters are calculated in the section view windows:
-
Lumen
-
Short diameter
-
Long diameter
with the percentage of stenosis.
If you set one section as a reference, then the diameter and lumen values for the other sections are relative to the corresponding values for the reference section. If you set two sections as a reference, then the values for the other sections are relative to the average values for the reference sections. It is recommended to locate the reference sections on both sides of the section of interest if the vessel narrows. To set the type of the section, select it from the drop-down list in the upper left-hand corner of the section view window (Fig. 7.11).
7.7.3 Curved surface analysis
____________________________________________________________________________________________
Functionality is available in a separate module which is activated in the Pro edition for an extra fee
____________________________________________________________________________________________
A vessel sweep is diaplayed in the Involute curve and Straightened vessel windows.
The Straightened vessel window displays the distance from the beginning of the vessel to the cross section.
To analyze the vessel interval, select this interval in the Straightened vessel window. To do this, move the cursor to the beginning of the interval and move the mouse to the end of the interval, holding down the left mouse button, then release the button. The built interval is shown in Fig. 7.12. The borders of the interval are diplayed as white sections.
The following parameters are calculated for the interval:
-
Length;
-
Avg lumen;
-
Min lumen;
-
Avg SD;
-
Min SD.
To move the interval border, move the cursor to the corresponding white section in any of the 3D view, Involute curve or Straightened vessel windows and move it with the mouse while holding down the left button. To delete an interval, click the left mouse button at an arbitrary place in the Straightened vessel window. To build multiple intervals, build them holding down the Ctrl key (or the Command key for macOS) on the keyboard.
7.7.4 Export vessel surface mesh
____________________________________________________________________________________________
Functionality is available in a separate module which is activated in the Pro edition for an extra fee
____________________________________________________________________________________________
To export the vessel surface to a file, click on the Export vessel surface mesh  button, in
the dialog that opens, select the file type (ply, obj or stl) and save the surface.
button, in
the dialog that opens, select the file type (ply, obj or stl) and save the surface.
To close the ends of the vessel, click on the arrow on the Export vessel surface mesh
button, select the Export parameters... item and in the dialog that opens, check the Close sides
box.