2.21. Evaluation of Blood Flow Parameters
____________________________________________________________________________________________
Functionality is available in the Pro edition
____________________________________________________________________________________________
 | This function cannot be used for establishing a diagnosis |
The evaluation of blood flow parameters based on phase-contrast images provides for:
-
obtaining the data concerned with the blood flow velocity and volume on the basis of phase-contrast images;
-
calculating the pulse-wave velocity (PWV parameter) on the basis of the data obtained.
To evaluate the blood flow parameters, you can use:
-
multiphase series of magnitude images or a magnitude MRI (MAG MRI);
-
multiphase series of phase-contrast images or a phase-contrast MRI (PC MRI).
2.21.1 Opening a Series in the Blood Flow Parameters Evaluation Mode
____________________________________________________________________________________________
Functionality is available in the Pro edition
____________________________________________________________________________________________
| | This function cannot be used for establishing a diagnosis |
To evaluate the blood flow parameters, proceed as follows:
-
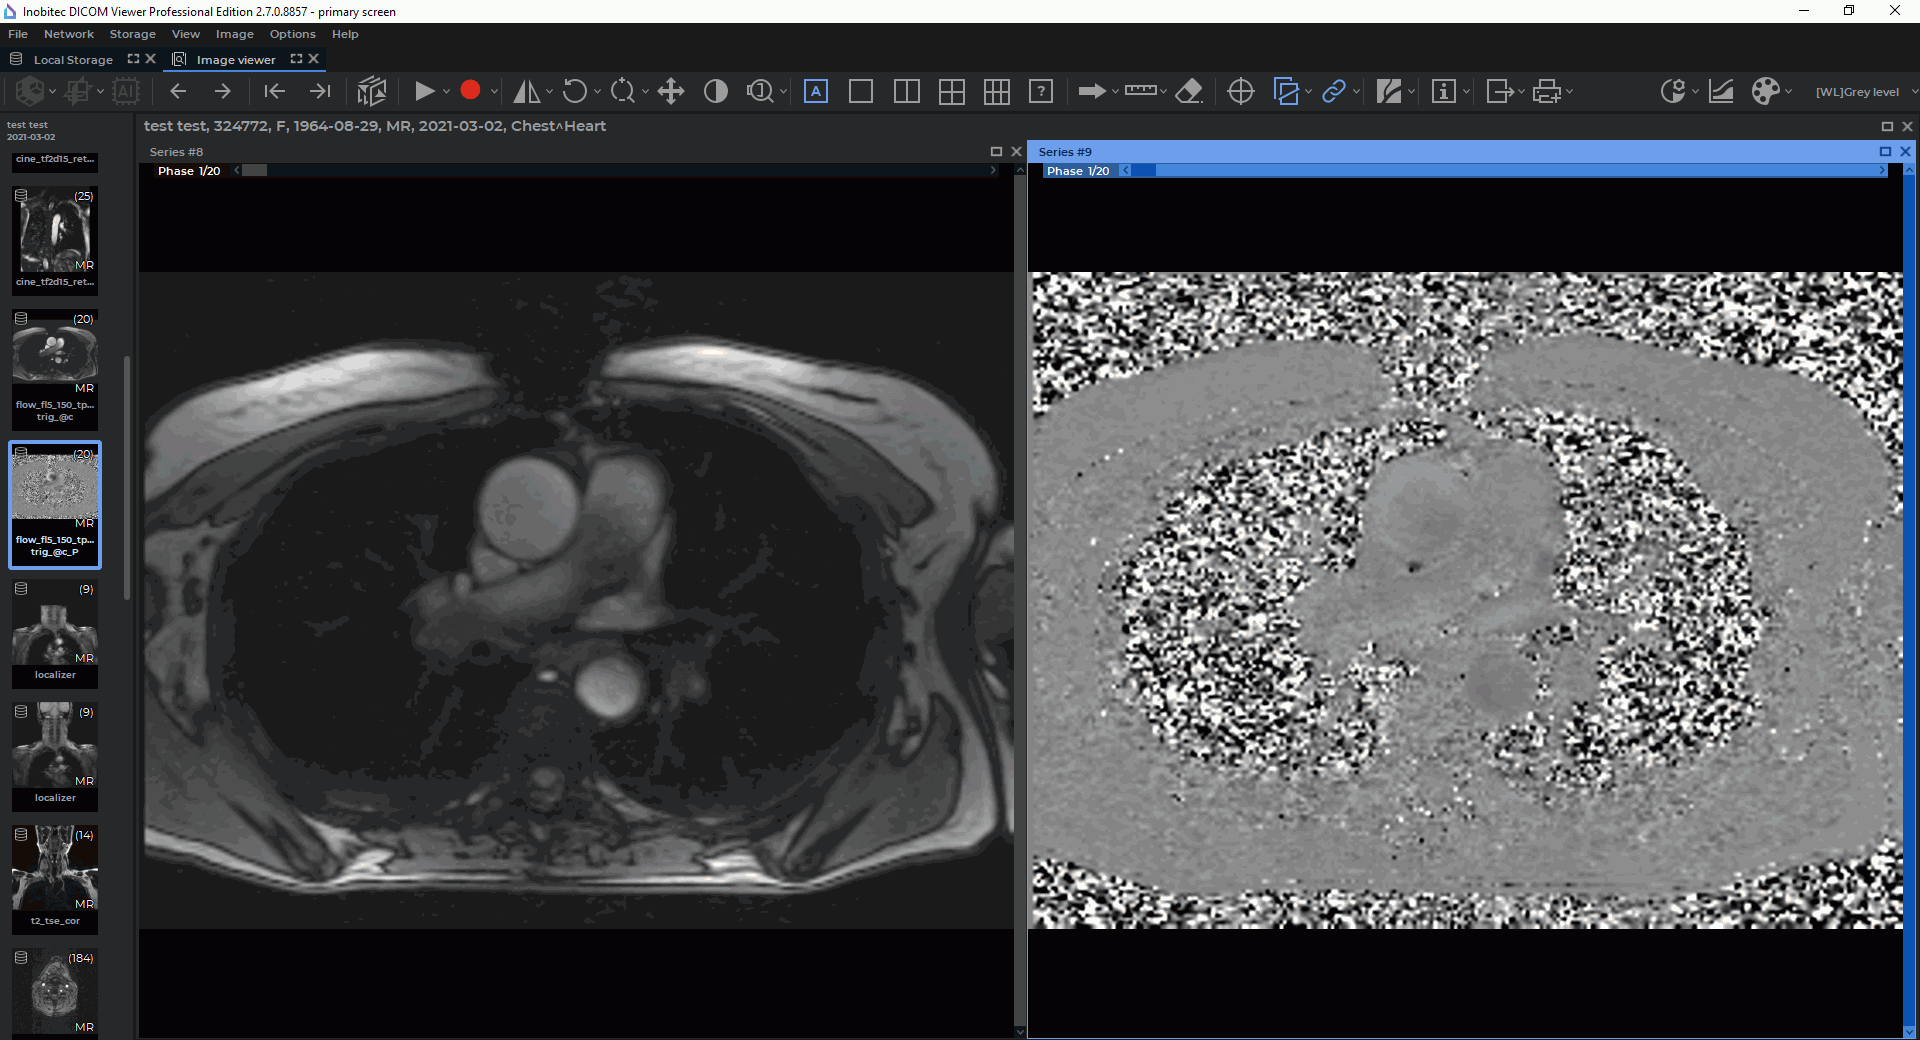
Open a suitable magnitude MRI (MAG MRI) series and the respective phase-contrast MRI (PC MRI) series in the flat image viewer window (Fig. 2.47). Make sure that the images have been sorted by number and phase (for details see Section 2.1). Each pair of series (MAG MRI and PC MRI) that can be used for blood flow analysis represents a separate slice.
-
On the Image main menu, choose the
 Flow analysis item.
-
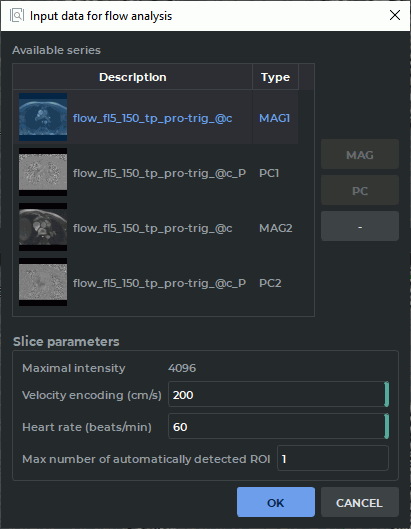
Provide the following parameters in the Input data for flow analysis dialog box (Fig. 2.48):
-
the Available series list is automatically filled with the series that have been opened in the window of the current tab. The search and the choice of a compatible MAG MRI and PC MRI couple from the list of the series available are performed automatically. The type of each series representing one of the detected slices is specified as <series type><slice number>, e.g. PC1 or MAG1. The values in the Type column are highlighted in red if:
-
One of the series (MAG MRI or PC MRI) has not been specified for the slice.
-
Not all the phase-contrast slice parameters have been provided.
-
An attempt to read the sequence of phases from the tags of a phase-contrast series has failed.
A sequence of phases is an ascending sequence of time values determined for each slice separately. The first element of the sequence is the value of the TriggerTime (0018, 1060) tag of the phase-contrast series. If a value in the Type column is highlighted in red, an error message will pop up as a balloon tip when you mouse over this value. If a compatible pair has not been determined automatically, select the series manually.
MAG MRI and PC MRI compatibility criteria:
-
the same number of phases (obligatory);
-
section position and orientation compatibility (obligatory);
-
the series must have the MR modality (recommended);
-
the series must be multiphase (obligatory);
-
the Manufacturer tag must comprise the SIEMENS value (recommended);
-
the contents of the ReferencedImageSequence tag sequence must be the same (recommended);
-
the ImageType tag must start with ORIGINAL\PRIMARY\P (for PC MRI) or ORIGINAL\PRIMARY\M (for MAG MRI) string expression (recommended).
When automatic search is being performed, all the listed criteria are to be taken into account; if the search is performed manually, only the obligatory criteria must be met. The series that can be selected manually do not belong to any slice (null values are assigned to such series in the Type column). To select a compatible pair of series manually, highlight the PC MRI series and click the PC button. Then select the respective MAG MRI series and click the MAG button. For each slice, an individual pair of PC MRI and MAG MRI series must be specified. The compatibility of the selected series must be tested according to the obligatory criteria.
In the Type column, specify the type in the <series type><slice number> format for each series representing one of the slices determined, e.g. PC1 or MAG1. If the highlighted series belongs to a slice that has already been selected, then the PC and MAG buttons will be unavailable.
If the selected series does not compliance with the obligatory criteria for PC MRI and MAG MRI selection, a dialog box is displayed with a message that the selected series cannot be set as PC MRI or MAG MRI.
To delete a slice, select the series corresponding to this slice and click the " — " button. In the Type column, a null value is assigned to each series representing a deleted slice. If the selected series does not belong to any of the slices, the " — " button will be deactivated.
-
-
Slice parameters are used to evaluate general blood flow parameters and are set automatically on the basis of PC MRI tags:
-
Minimum and maximum intensity;
-
Minimum and maximum velocity encoding (cm/s). When you specify the parameter manually, the new value is set for all the slices for which this parameter cannot be taken from the PC MRI series tags;
-
Heart rate (beats/min);
-
Max number of automatically detected ROI is used to restrict the maximum number of vessels ROI set by default when the panel is opened. As the algorithm for automatic recognition of vessel contours creates the list in the order of descending accuracy, this parameter allows for excluding odd ROI from consideration. The default value of the Max number of automatically detected ROI parameter is 2 (if only one slice has been selected) or 1 (if two or more slices have been selected). If the value of this parameter has not been provided, then the blood flow parameters will be estimated for all the vessels detected automatically.
Not all the required parameters may be set automatically, but only some of them. In such a case, the rest of the parameters specified in the dialog box are to be set manually.
-
-
-
Click the OK button to provide the data for blood flow analysis. Click the CANCEL button to cancel the data input.
If you have not provided all the required parameters in the Input data for flow analysis dialog box (Fig. 2.48), the OK button will be inactive.
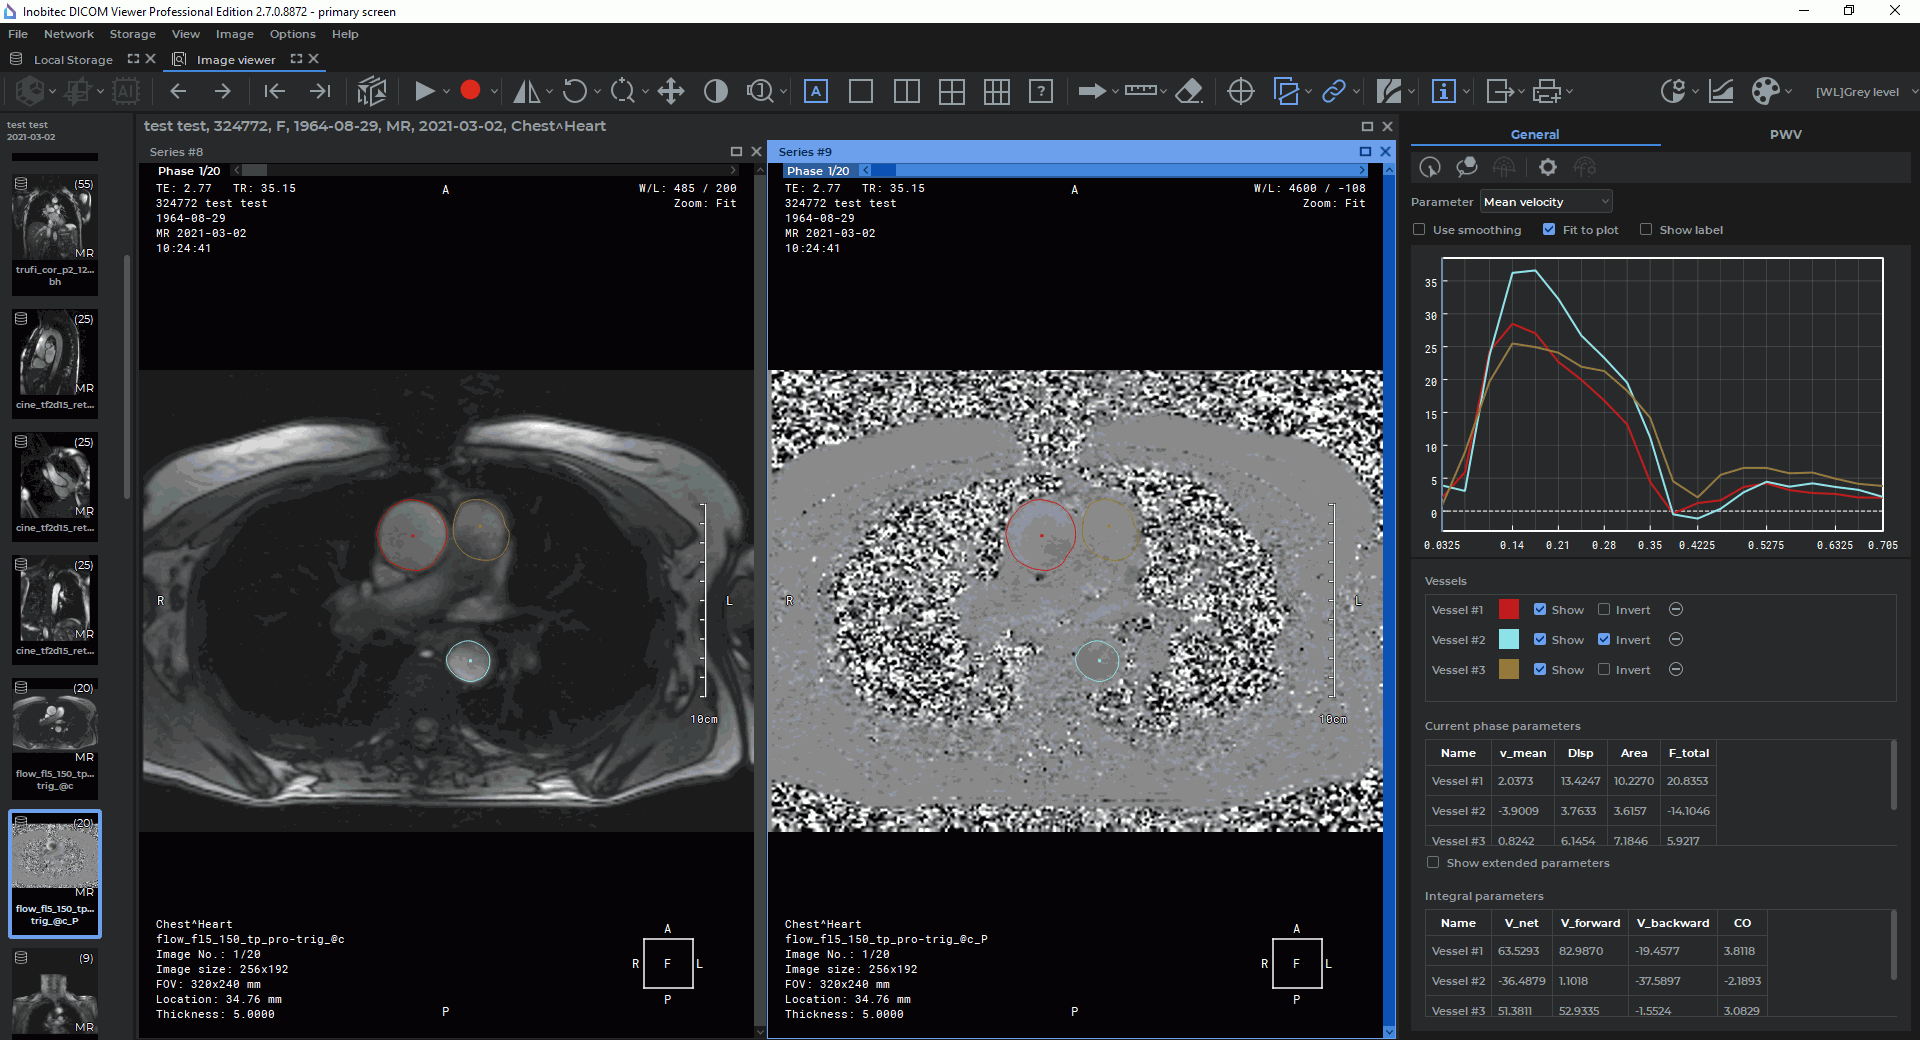
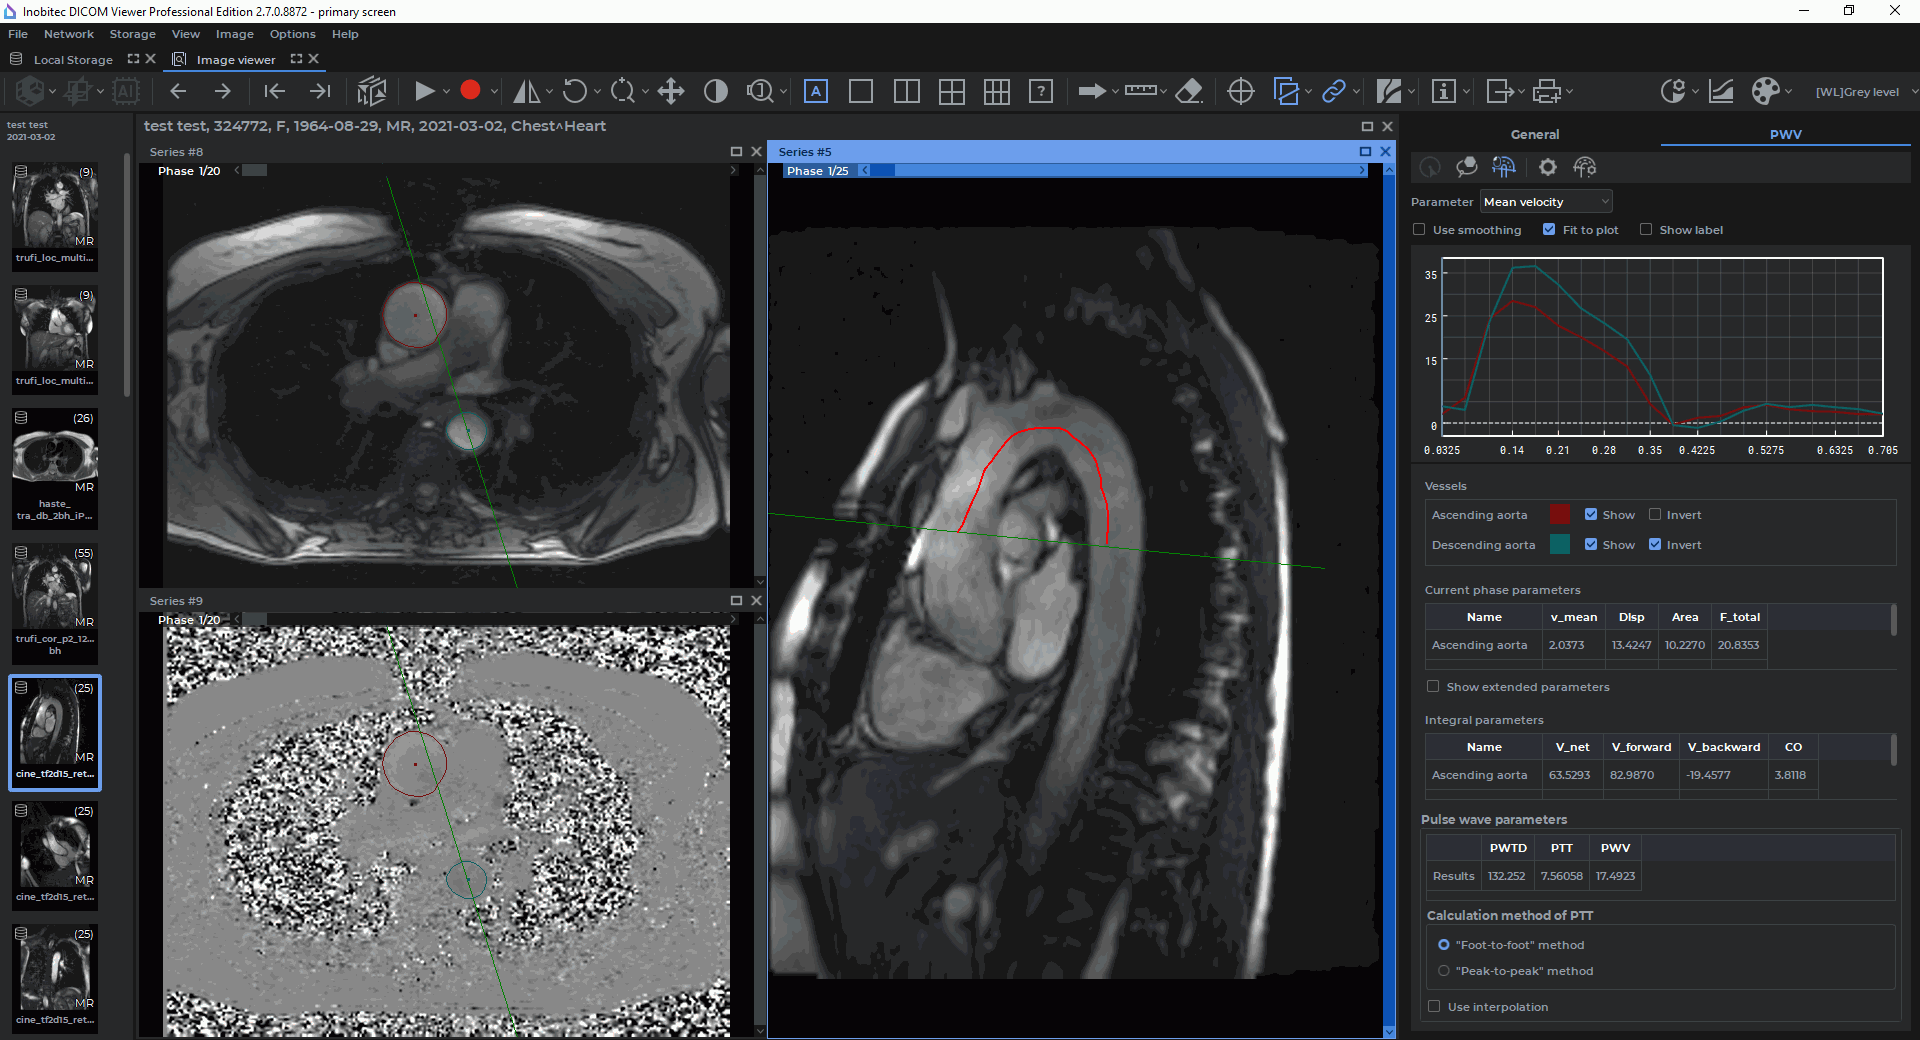
The vessels ROI that are built in the MAG MRI series window are reproduced in the PC MRI series window. The blood flow analysis panel where the obtained results for all the vessels found will be presented as graphs and tables will appear on the right-hand side of the tab (Fig. 2.49).
When one of the windows (MAG MRI or PC MRI) is closed, the blood flow analysis panel is deactivated and all the vessels, as well as the evaluation results, are deleted.
On the General tab, general blood flow results are analyzed for each vessel detected. On the PWV tab advanced analysis of blood flow results is performed, which includes the calculation of additional parameters, such as: pulse wave velocity (PWV) and pulse transit time (PTT).
2.21.2 Changing the Configuration Parameters for a PC MRI Series
____________________________________________________________________________________________
Functionality is available in the Pro edition
____________________________________________________________________________________________
| | This function cannot be used for establishing a diagnosis |
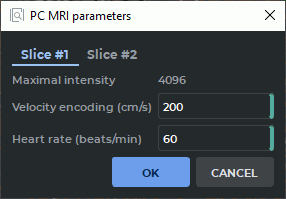
To change the configuration parameters for a PC MRI series in the process of work,
click the  PC MRI parameters button on the blood flow analysis panel. The
current values of the parameters are shown in the PC MRI parameters dialog box
(Fig. 2.50).
PC MRI parameters button on the blood flow analysis panel. The
current values of the parameters are shown in the PC MRI parameters dialog box
(Fig. 2.50).
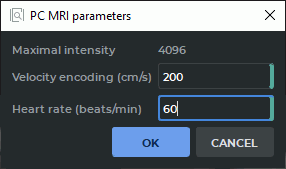
Change the values of the parameters. If you have not provided all the required parameters in the PC MRI parameters dialog box, the OK button will be inactive.
To reevaluate the blood flow parameters for all the vessels considered, click the OK button. To cancel, click the CANCEL button.
2.21.3 Building and Editing Vessels ROI
____________________________________________________________________________________________
Functionality is available in the Pro edition
____________________________________________________________________________________________
| | This function cannot be used for establishing a diagnosis |
To evaluate general blood flow parameters for each of the vessels detected, go to the General tab.
To add ROI for the vessels that have not been included in the list by default, proceed as follows:
-
With the left, right or middle mouse button, activate the
 Detect vessel ROI by
point tool on the panel for blood flow parameters evaluation. Use the same button to
work with the tool. For details on working with tools, see Section 1.14.
Detect vessel ROI by
point tool on the panel for blood flow parameters evaluation. Use the same button to
work with the tool. For details on working with tools, see Section 1.14.

Attention! The tool works only in the MAG MRI window selected in the “Input data for flow analysis” dialog box (Fig. 2.48). If you choose a window from a different series, you will be notified that the tool is not available for the window selected. -
Click on a magnitude image (MAG MRI), at a point where you expect to find a vessel. The ROI for the vessel detected will be built for all the phases, with consideration for the position and the size of the vessel section in each phase. A new vessel will be added to the list placed on the blood flow parameters evaluation panel, and the parameters evaluated will be presented as graphs and tables. If no vessel ROI is detected in the point specified, you will be notified that there is no vessel ROI at this point.
The Detect vessel ROI by point tool may be used for restoring the vessels that were
deleted earlier.
To build or edit a vessel ROI with contour lines, proceed as follows:
-
With the left, right or middle mouse button, activate the
 Vessel ROI (contour)
tool on the panel for blood flow parameters evaluation. Use the same button to work with
the tool. For details on working with tools, see Section 1.14.
Vessel ROI (contour)
tool on the panel for blood flow parameters evaluation. Use the same button to work with
the tool. For details on working with tools, see Section 1.14.
-
Press and hold the mouse button to create a contour. Release the button to finish the process and to close the contour. A new vessel will be added to the list placed on the blood flow parameters evaluation panel, and the parameters evaluated will be presented as graphs and tables.
The Vessel ROI (contour) tool provides an opportunity to edit the ROI of automatically
detected vessels.
On the PWV tab, the Vessel ROI (contour) tool is only available for editing vessels ROI.
Edit the ROI for each phase. The following editing methods are available:
-
changing the ROI shape. o change the ROI shape, mouse over the contour of the ROI to be edited. The ROI contour line will be highlighted. Press the mouse button at the point where you want to edit the contour and draw a new line while holding the button. Release the mouse button to finish the editing process. All the blood flow parameters for the vessel will be reevaluated. Press Esc on your keyboard while still holding the mouse button to cancel the building or editing operations for the current contour;
-
moving the ROI. o move a ROI, mouse over the contour of the ROI to be moved. Move the mouse while holding the mouse button and the Shift key on the keyboard.
2.21.4 Blood Flow Analysis Panel. Displaying the Results of General Blood Flow Analysis
____________________________________________________________________________________________
Functionality is available in the Pro edition
____________________________________________________________________________________________
| | This function cannot be used for establishing a diagnosis |
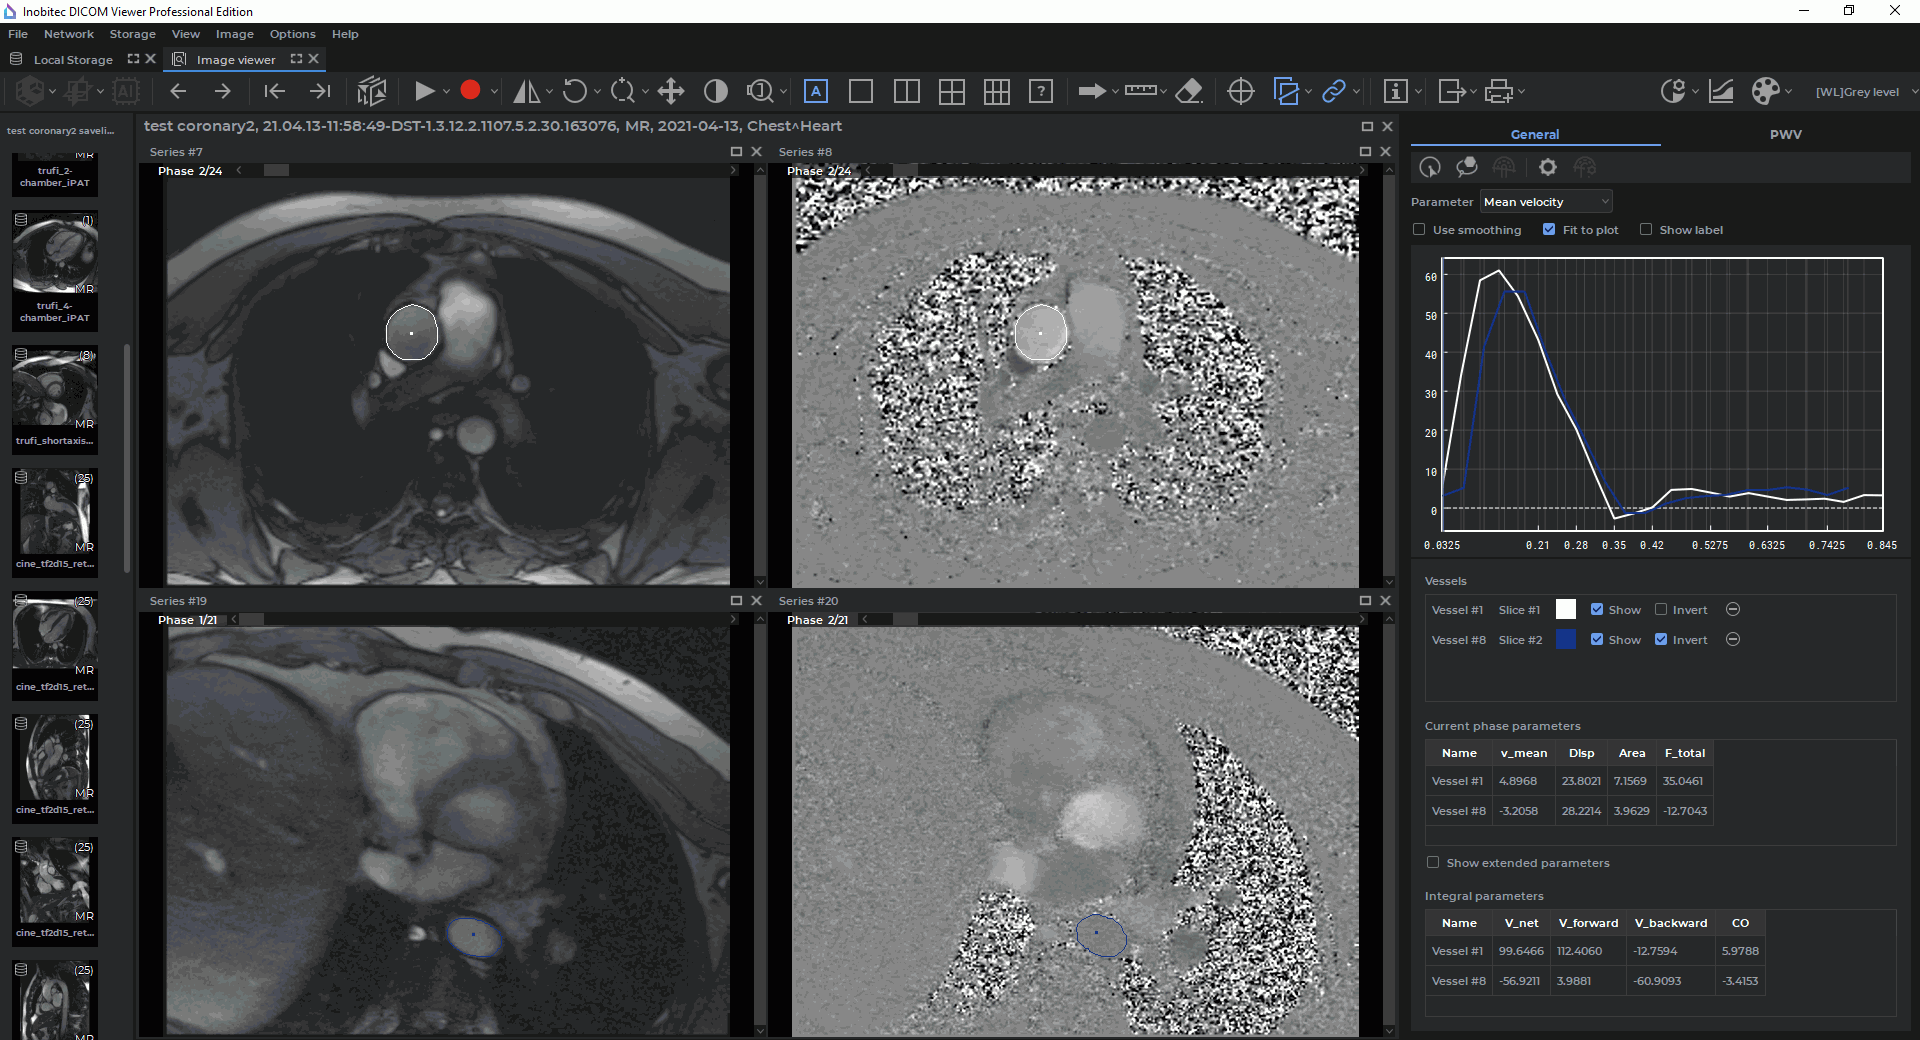
On the General tab, general blood flow results are analyzed for each vessel detected. The results of general blood flow analysis are presented as graphs and tables.
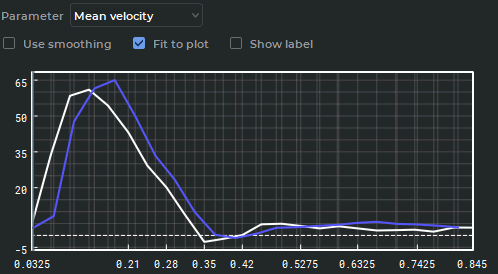
On the coordinate plane (Fig. 2.51) graphical data for the parameter selected from the drop-down list are presented:
-
Mean velocity;
-
Velocity dispersion;
-
Area;
-
Total flow.
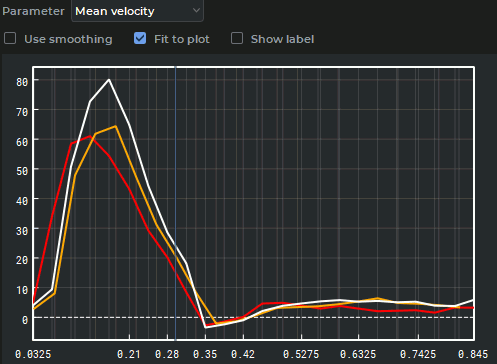
The time values are shown on the x-axis, while the values of the parameter chosen
from the drop-down list are shown on the y-axis. The range of values for the time axis is
formed by combining the phase sequences for all the slices. The resulting sequence does not
contain any matching values and is sorted in ascending order. The current phase position is
marked by a blue slider. In the series window, the phase that is the closest to the time value
marked by the slider on the graph is selected as the current phase. To change the current
phase, mouse over the slider so that the cursor is displayed as ![]() . While holding the left
mouse button, move the slider to the right or to the left. When you move the slider, the
current phase is changed in PC MRI and MAG MRI windows. When you change the current
phase, the results presented in the Current phase parameters table are also changed
(Fig. 2.53).
. While holding the left
mouse button, move the slider to the right or to the left. When you move the slider, the
current phase is changed in PC MRI and MAG MRI windows. When you change the current
phase, the results presented in the Current phase parameters table are also changed
(Fig. 2.53).
To move the graph along the y-axis, move the mouse up and down while holding the left mouse button and the Shift key on the keyboard. To scale the graph, move the mouse up and down while holding the left mouse button and the Ctrl key (or the Command key for macOS) on the keyboard.
To smooth the graphical data by cubic spline interpolation, check the Use smoothing box. By default, this option is disabled. The Fit to plot box is used to adjust the graph to the size of the window. The box is checked by default. The Show label box is used to show the position of the point where the cursor is placed. By default, this option is disabled.
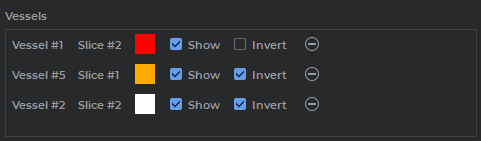
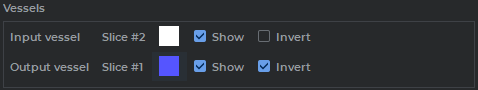
The Vessels table (Fig. 2.52) is used to adjust the display settings for the vessels ROI and graphs. The table shows the number of the slice with the vessel. When you mouse over a cell with a slice number, a balloon tip with the basic data on the slice pops up.
You can perform the following actions with the settings for vessels ROI and graphs:
-
renaming. Double-click on the name of the vessel with the left mouse button. Type the new name and press Enter n the keyboard. The new name of the vessel will be shown in the respective cells of the tables displaying the blood flow parameters;
-
changing the color. Click on the color icon next to the name of the vessel and select the color in the dialog box. The color icon, the ROI contours for all the phases, and the graphs for the selected vessel will be changed accordingly;
-
adjusting visibility. To hide/show the ROI contours for all the phases, as well as the graphs for the selected vessel, tick/untick the Show box;
-
inverting the graph. To invert the graph values (reverse the sign), check the Invertbox. By default, this box is only checked for the vessels with backward blood flow volume. The graph values are inverted for Mean velocity and Total flow parameters;
-
deleting. To delete a selected vessel, click the
 button. All the data for this vessel
will be deleted: the ROI for all the phases, the graph and the evaluation results from the
tables, the blood flow parameters.
button. All the data for this vessel
will be deleted: the ROI for all the phases, the graph and the evaluation results from the
tables, the blood flow parameters.
The deleted vessel may be restored with the Detect vessel ROI by point tool (see
Section. 2.21.3).
In the Current phase parameters table (Fig. 2.53), you will find the basic blood flow parameters:
-
Mean velocity (v_mean);
-
Velocity dispersion (Disp);
-
Area;
-
Total flow (F_total).
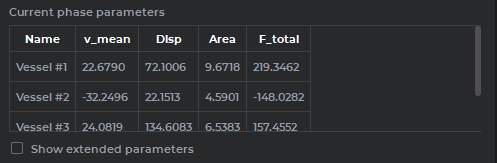
Tick the Show extended parameters box to display the following additional parameters in the table:
-
Min velocity (v_min);
-
Max velocity (v_max);
-
Positive flow (F_positive);
-
Negative flow (F_negative).
The parameters shown in the Current phase parameters table are time-dependent and change with the current phase.
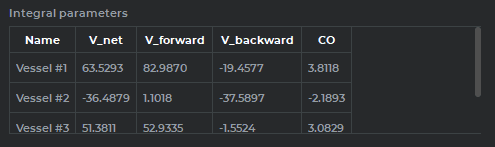
In the Integral parameters table (Fig. 2.54), the values of the following parameters are shown:
-
Net volume (V_net);
-
Forward volume (V_forward);
-
Backward volume (V_backward);
-
Cardiac output (CO).
These parameters are not time-dependent and do not change with the current phase.
2.21.5 Evaluating the General Blood Flow Analysis Parameters
____________________________________________________________________________________________
Functionality is available in the Pro edition
____________________________________________________________________________________________
| | This function cannot be used for establishing a diagnosis |
The following parameters are calculated while performing general blood flow analysis:
-
Phase parameters:
-
Mean velocity (vmean, measured in cm/s). This parameter is calculated as the mean value for all the velocity values evaluated for each point of the ROI. The velocity for a particular ROI point is calculated according to the formula below:
(2.2) where V k is the velocity at the k-th point of ROI;
Ik is the intensity value at the k-th point of ROI;
Imin is the minimum intensity for the series;
Imax is the maximum intensity for the series;
V ENCmin is the minimum velocity encoding value;
V ENCmax is the maximum velocity encoding value; -
Velocity dispersion (Disp). This parameter is calculated as the velocity variance for each point of the ROI;
-
Area (Area, measured in cm2). This parameter is calculated as the area of the ROI;
-
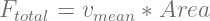
Total flow (Ftotal, measured in ml/s). The value is calculated according to the formula below:
(2.3) -
Min velocity (vmin, measured in cm/s). The value is calculated as the minimum velocity among all the points of the ROI;
-
Max velocity (vmax, measured in cm/s). The value is calculated as the maximum velocity among all the points of the ROI;
-
Positive flow (Fpositive, measured in ml/s). The value is calculated according to the formula below:
(2.4) where vmean positive is the mean velocity for all the ROI points with positive velocity values,
Areapositive is the area of all the points with positive velocity values; -
Negative flow (Fnegative, measured in ml/s). The value is calculated according to the formula below:
(2.5) where vmean negative is the mean velocity for all the ROI points with negative velocity values,
Areanegative is the area of all the points with negative velocity values;
-
-
Integral parameters:
-
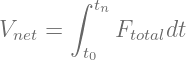
Net volume (V net, measured in ml). The value is calculated according to the formula below:
(2.6) where Ftotal is the blood flow,
t0 is the time of the first phase,
tn is the time of the last phase; -
Forward volume (V forward, measured in ml). The value is calculated according to the formula below:
(2.7) where Fpositive is the positive blood flow,
t0 is the time of the first phase,
tn is the time of the last phase; -
Backward volume (V backward, measured in ml). The value is calculated according to the formula below:
(2.8) where Fnegative is the negative blood flow,
t0 is the time of the first phase,
tn is the time of the last phase; -
Cardiac output (CO, measured in l/min). The value is calculated according to the formula below:
(2.9) where V net is the blood flow volume,
HR is the heart rate.
-


2.21.6 Designing a Trajectory for the Pulse Wave
____________________________________________________________________________________________
Functionality is available in the Pro edition
____________________________________________________________________________________________
| | This function cannot be used for establishing a diagnosis |
You need to build a trajectory for the pulse wave to calculate the Pulse wave travel distance auxiliary parameter, which is used for Pulse wave velocity parameter evaluation.
| | Attention! To build the pulse wave trajectory, the study must contain a sagittal plane series. |
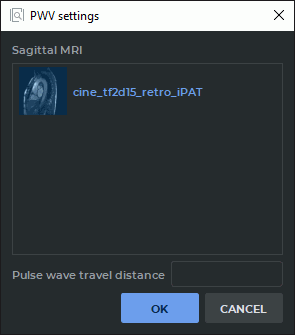
If there is no sagittal plane series in the study, but the pulse wave travel distance is known, it can be entered manually by the user in the PWV settings dialog box (Fig. 2.55). For details see Section 2.21.7.
To design a pulse wave trajectory, proceed as follows:
-
Open the MAG MRI and PC MRI series in the blood flow parameters evaluation mode (for details see Section 2.21.1).
-
Open a sagittal plane study series. To simplify the process of building the trajectory, we advise you to enable the display of scout lines in the selected window (see Section 2.26).
-
Go to the PWV tab. When you first click on the PWV tab the PWV settings dialog box is displayed (Fig. 2.55).
Any two sections of the same vessel placed on the same slice or on different slices may be selected as the input and output vessels. The vessel characterized by a smaller time to peak value of the blood flow graph is selected as the input vessel. If the time to peak values are the same for both vessels, the one placed higher on the Vessels table is selected as the input vessel. The PWV tab will be available after such a pair of vessels has been found. -
In the PWV settings dialog box (Fig. 2.55), you will see the list of the series opened in the current study window, except for those that have been selected as the PC MRI and MAG MRI. Select a sagittal plane study series.
To proceed with building the pulse wave trajectory, click the OK button, to go back to the General tab, click CANCEL.
If you have not chosen a series from the Sagittal MRI ist or entered the pulse wave travel distance value (for details see Section 2.21.7), the OK button will be disabled.
-
Activate the
 Pulse wave travel path tool on the panel for blood flow parameters
evaluation with the left, right, or middle mouse button. Use the same button to work with the
tool. For details on working with tools, see Section 1.14.
Pulse wave travel path tool on the panel for blood flow parameters
evaluation with the left, right, or middle mouse button. Use the same button to work with the
tool. For details on working with tools, see Section 1.14.
Attention! The "Pulse wave travel path" tool may only be activated may if the current tab is the "PWV" tab. -
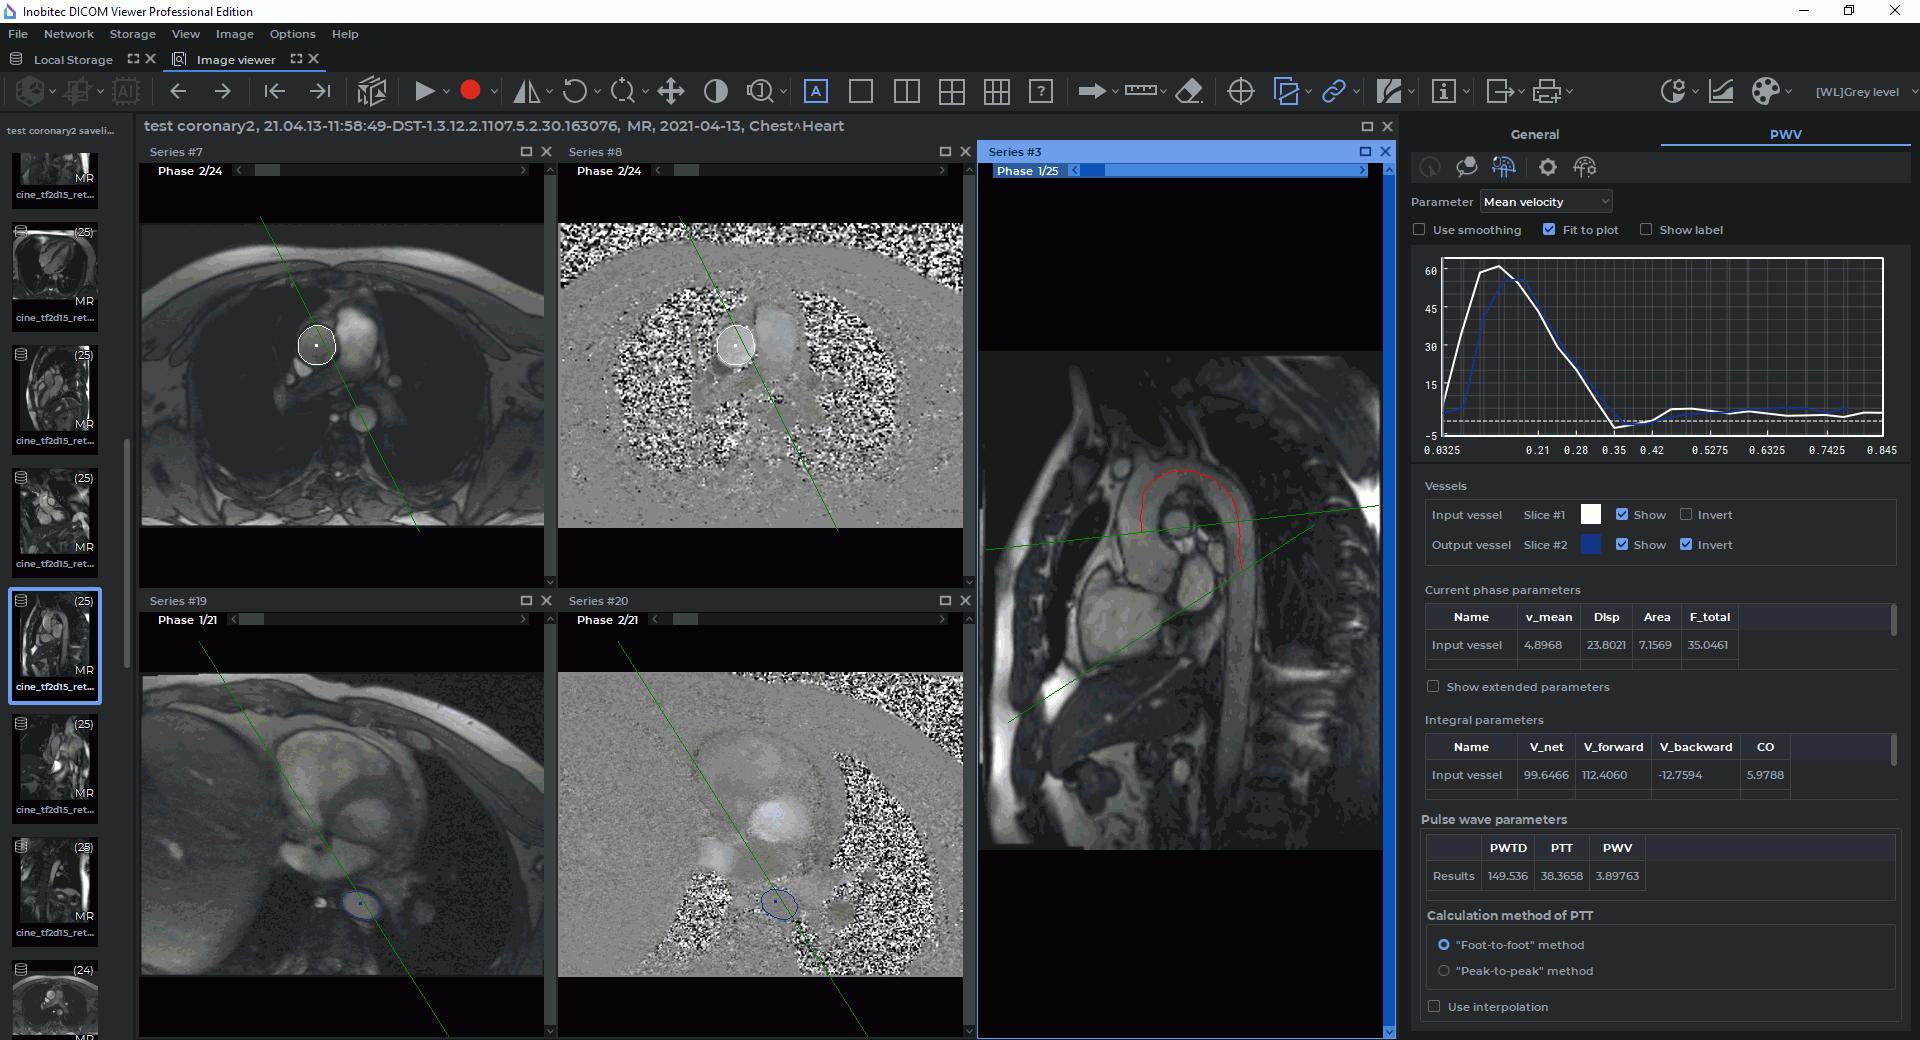
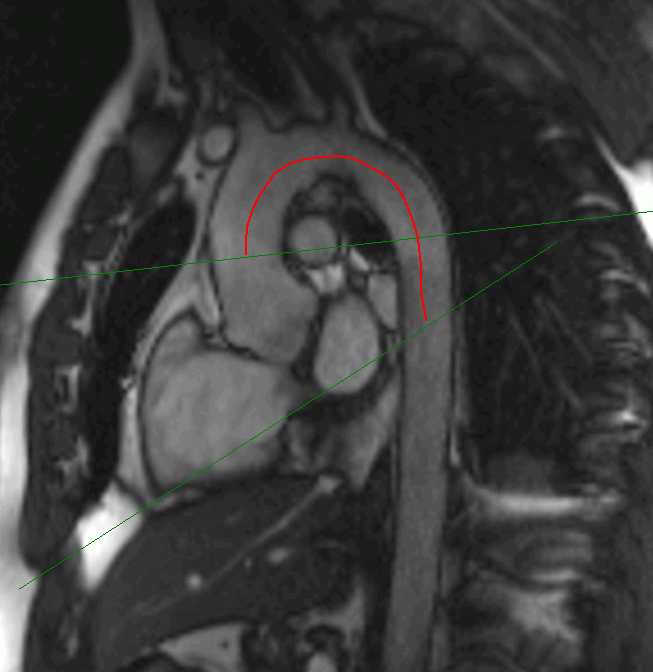
Press and hold the mouse button to build the trajectory. Release the button to finish the process. The trajectory must connect the two different slices of the vessel (Fig. 2.56). The pulse wave trajectory is smoothed to fend off aliasing which causes lengthening of the curve.
-
To edit a trajectory, mouse over the line to be edited. The trajectory line will be highlighted. Press the mouse button at the point where you want to edit the trajectory and draw a new line towards one of the ends of the trajectory while holding the button. Release the mouse button to finish the editing process. All the parameters for advanced blood flow analysis will be reevaluated. Press Esc on your keyboard while still holding the mouse button to cancel the trajectory building or editing operations.
You can change the Pulse Wave Travel Distance (PWTD) value in three ways:
-
by editing the trajectory of the pulse wave;
-
by clicking on the
 PWV settings button and enter a new value in the dialog box.
Previously constructed pulse wave trajectory is removed;
PWV settings button and enter a new value in the dialog box.
Previously constructed pulse wave trajectory is removed;
-
by manually changing the value in the PWTD column of table Pulse wave parameters. Previously constructed pulse wave trajectory is removed.
If after returning to the General tab, you delete one of the vessels considered in the process of advanced blood flow analysis, the pulse wave trajectory and the pulse wave parameters (PWTD, PTT, and PWV) will be deleted.
If you close the sagittal plane window, the pulse wave trajectory designed will be deleted, but the PWTD, PTT, and PWV parameters will be saved.
2.21.7 Getting the Results of Advanced Blood Flow Analysis without Building a Pulse Wave Trajectory
____________________________________________________________________________________________
Functionality is available in the Pro edition
____________________________________________________________________________________________
| | This function cannot be used for establishing a diagnosis |
If there is no sagittal plane series in the study, but the pulse wave travel distance is known, you may enter this value manually to display the results of advanced blood flow analysis.
To get the results of advanced blood flow analysis without building a pulse wave trajectory, proceed as follows:
-
Open the MAG MRI and PC MRI series in the blood flow parameters evaluation mode (for details see Section 2.21.1).
-
Go to the PWV tab. When you first click on the "PWV" tab the PWV settings dialog box is displayed Fig. 2.57).
Any two sections of the same vessel placed on the same slice or on different slices may be selected as the input and output vessels. The vessel characterized by a smaller time to peak value of the blood flow graph is selected as the input vessel. If the time to peak values are the same for both vessels, the one placed higher on the Vessels table is selected as the input vessel. The PWV tab will be available after such a pair of vessels has been found. -
In the PWV settings dialog box (Fig. 2.57), enter the pulse wave travel distance value (in millimeters).
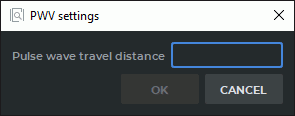
To get the results of advanced blood flow analysis, click the OK button. To go back to the General tab, click the CANCEL button.
you have not provided the pulse wave travel distance value in the dialog box (Fig. 2.57), the OK button will be inactive.
You can change the Pulse Wave Travel Distance (PWTD) value in two ways:
-
by clicking on the
PWV settings button and enter a new value in the dialog box;
-
by manually changing the value in the PWTD column of table Pulse wave parameters.
2.21.8 Blood Flow Analysis Panel. Displaying the Results of Advanced Blood Flow Analysis
____________________________________________________________________________________________
Functionality is available in the Pro edition
____________________________________________________________________________________________
| | This function cannot be used for establishing a diagnosis |
The results of advanced blood flow analysis are displayed as graphs and tables.
Chart display settings are configured similarly to the settings of charts on the General tab (see Section 2.21.4).
The Vessels table (Fig. 2.59) s used to customize the display settings for the vessels’ ROI and graphs.
The ROI display and vessels graph settings are described in the Section 2.21.4.
In the Current phase parameters table are displayed the blood flow parameters. Similar to the table on the General tab (see Section 2.21.4).
In the Integral parameters table integral blood flow parameters are displayed. Similar to the table on the General tab (see Section 2.21.4).
In the Pulse wave parameters table (Fig. 2.60) you will see the results of the evaluation of the following parameters:
-
Pulse wave travel distance (PWTD).There are three ways to specify this parameter:
-
Pulse transit time (PTT);
-
Pulse wave velocity (PWV).
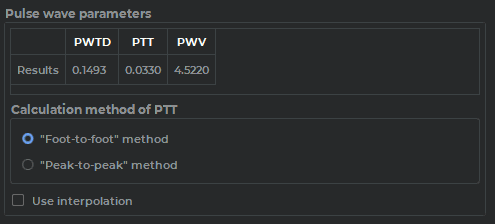
If the PWTD parameter has not been specified, in the respective cell of the table, you will see a No data sign instead of the assessment result. The PTT and PWV parameters will be calculated automatically. If an error occurs during the calculation procedure, you will see a No data sign in the cell for the respective parameter.
In the section named Calculation method of PTT, you choose the method of calculating the pulse transit time:
-
Foot-to-foot (the default value);
-
Peak-to-peak.
The Use interpolation check box enables cubic spline interpolation of the data for PTT calculation. When you check/uncheck this box, the PPT and PWV parameters will be reevaluated.
2.21.9 Evaluation of the Parameters for Advanced Blood Flow Analysis
____________________________________________________________________________________________
Functionality is available in the Pro edition
____________________________________________________________________________________________
| | This function cannot be used for establishing a diagnosis |
In advanced blood flow analysis for the vessel slices pair, the PWV parameter is calculated based on two auxiliary parameters.
Advanced blood flow analysis implies the calculation of additional parameters, such as:
-
Pulse wave travel distance (PWTD, measured in mm). This parameter is calculated as the distance between a pair of vessel slices. The trajectory between the sections may be built with the Pulse wave travel path tool;
-
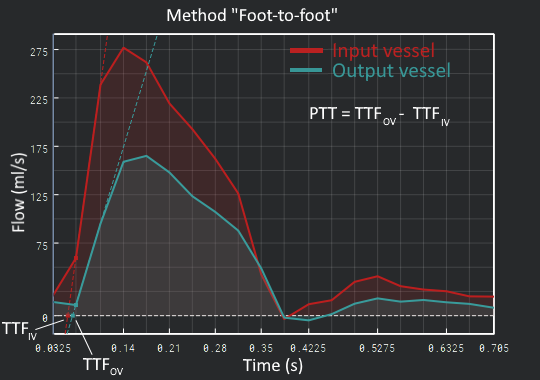
Pulse transit time (PTT, measured in ms). This parameter is calculated on the basis of the blood flow graphs of vessel slices by two methods:
-
Foot-to-foot. The value is calculated according to the formula below:
(2.10) where TTFOV is the time to the foot of the output vessel graph,
TTFIV is the time to the foot of the intput vessel graph;
-
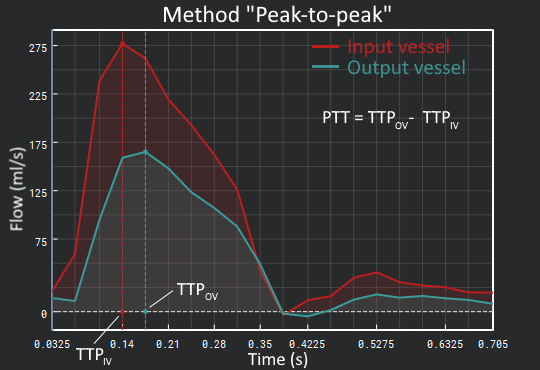
Peak-to-peak. The value is calculated according to the formula below:
(2.11) where TTPOV is the time to the peak of the output vessel graph,
TTPIV is the time to the peak of the intput vessel graph;
-
-
Pulse wave velocity (PWV , measured in m/s). The value is calculated according to the formula below:
(2.12)


2.21.10 Blood Flow Parameters Evaluation for Two Slices
____________________________________________________________________________________________
Functionality is available in the Pro edition
____________________________________________________________________________________________
| | This function cannot be used for establishing a diagnosis |
Each pair of series (MAG MRI and PC MRI) that can be used for blood flow analysis represents a separate slice. Besides the PWV parameter evaluation, work with two or more slices provides an opportunity to compare common blood flow parameters for sections of the vessels placed on different slices.
To perform blood flow parameters evaluation for two slices, proceed as follows:
-
Open several pairs of series (MAG MRI and PC MRI) suitable for blood flow analysis. Each pair of series represents a separate slice. Provide the missing parameters if required (see Section 2.21.1).
-
To change the configuration parameters for a PC MRI series, click the
PC MRI
parameters button on the blood flow analysis panel. in the PC MRI parameters dialog box
(Fig. 2.64) change the current parameter values for each slice. For more information see
Section 2.21.2.
-
Build or edit the vessel ROI for each slice (see Section 2.21.3).
On the General tab, general blood flow results are analyzed for each vessel detected. The results of general blood flow analysis are presented as graphs and tables. For more information see Sections 2.21.4 and 2.21.5).
-
To evaluate the PWV parameter, build a trajectory for the pulse wave between the selected vessel sections Fig. 2.65, (see Section 2.21.6). If there is no sagittal plane series in the study but the pulse wave travel distance is known, enter the value manually (see Section 2.21.7).
In the PWV tab (Fig. 2.66) of the blood flow analysis panel, the results of advanced blood flow analysis are shown as graphs and tables (see Sections 2.21.8 and 2.21.9).