This tool allows you to create graphic labels (as arrows, ellipses, polygons, freeform lines and text fields) on an image. The labels will be applied during the entire session of working with the series. The labels are attached to specific points on the image and panned, scaled or rotated together with the image.
The button design depends on the selected tool. The default tool is Arrow, and the tool selection
button looks like this: ![]() .
.
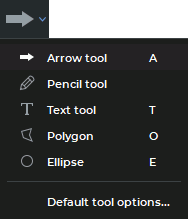
To activate/deactivate the selected tool, click on the graphic label tool selection button. To select and activate one of the tools, click on the right side of the tool selection button and select the tool (Fig. 2.94).
This tool is also available from the image context menu and from the Image main menu item.
The annotation tools are available on the MPR reconstruction, Vessel analysis, Coronary artery analysis, Cardiac analysis and PET Analysis tabs.
To create a label on an image:
Activate the Arrow tool by clicking the left/right/middle mouse button. The button will
look as follows: ![]() . To continue work with this tool, use the button with which the
tool was activated. To learn more about tool control, see Section 1.14.
. To continue work with this tool, use the button with which the
tool was activated. To learn more about tool control, see Section 1.14.
You can draw a arrow in two ways:
Press the mouse button at the point where the arrow tip is to be placed and, while holding the mouse button, move the cursor to the opposite end of the arrow. To fix the point, release the mouse button.
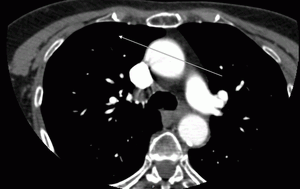
Click the mouse button at the point where the arrow tip is to be placed. Click the mouse button again where the opposite end of the arrow should be placed. The arrow is shown in Fig. 2.95.
To cancel an incomplete creation, press Esc.
To create a freeform shapes and lines on an image:
Activate the Pencil tool by clicking the left/right/middle mouse button. The button will
look as follows:  . To continue work with this tool, use the button with which the
tool was activated. To learn more about tool control, see Section 1.14.
. To continue work with this tool, use the button with which the
tool was activated. To learn more about tool control, see Section 1.14.
Click the mouse button at the point where you want the line to begin and, while holding the mouse button, move the cursor. This displays a line that follows the cursor trajectory. To complete the drawing, release the mouse button.
To cancel an incomplete creation, press Esc.
To create a text label on an image:
Activate the Text tool by clicking the left/right/middle mouse button. The button will
look as follows:  . To continue work with this tool, use the button with which the
tool was activated. To learn more about tool control, see Section 1.14.
. To continue work with this tool, use the button with which the
tool was activated. To learn more about tool control, see Section 1.14.
Click the mouse button where the text should be located.
Enter text in the Edit text dialog box and click OK to add it to the image or CANCEL to cancel the action.
To create a polygon on an image:
Activate the Polygon tool by clicking the left/right/middle mouse button. The button
will look as follows:  . To continue work with this tool, use the button with which
the tool was activated. To learn more about tool control, see Section 1.14.
. To continue work with this tool, use the button with which
the tool was activated. To learn more about tool control, see Section 1.14.
Click the mouse button where the first point of the polygon should be located.
Move the cursor to the location of the next point. The lines connecting the points of the polygon will be displayed on the screen.
Click the mouse button to save the point.
Repeat Steps 3 and 4 until the last but one point is set.
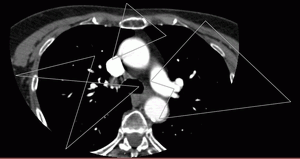
Double-click the mouse to create the last point. The polygon is complete (Fig. 2.96).
To cancel an incomplete creation, press Esc.
To create an ellipse on an image:
Activate the Ellipse tool by clicking the left/right/middle mouse button. The button will
look as follows:  . To continue work with this tool, use the button with which the
tool was activated. To learn more about tool control, see Section 1.14.
. To continue work with this tool, use the button with which the
tool was activated. To learn more about tool control, see Section 1.14.
To build an ellipse, just build the rectangle the ellipse is inscribed into. You can draw an ellipse in two ways:
Click the mouse button to mark the first end of the ellipse and while holding the mouse button move the cursor to the place where the opposite end should be located. The ellipse will be displayed on the screen. To fix the point, release the mouse button.
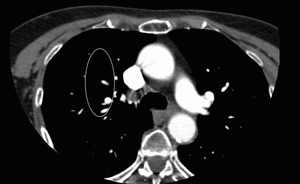
Click the mouse button to mark the first end of the ellipse. Move the cursor to the place where the opposite end of the ellipse should be located. The ellipse will be displayed on the screen. To fix the second end of the ellipse, click the mouse button. The ellipse is shown in Fig. 2.97.
To cancel an incomplete creation, press Esc.
____________________________________________________________________________________________
Functionality is available in the Pro edition
____________________________________________________________________________________________
The Spine labeling tool is used for labeling cervical, thoracic, lumbar, and sacral vertebrae in the images of the series in the Image viewer tab.
To label vertebrae, proceed as follows:
Open the respective study series in the Image viewer tab.
Activate the Spine labeling tool with the left, right, or middle mouse button. The tool
on the toolbar will be shown as  . To continue work with this tool, use the button
with which the tool was activated. To learn more about tool control, see Section 1.14.
This tool is also available on the image context menu, as well as in the Image section of
the main menu.
. To continue work with this tool, use the button
with which the tool was activated. To learn more about tool control, see Section 1.14.
This tool is also available on the image context menu, as well as in the Image section of
the main menu.
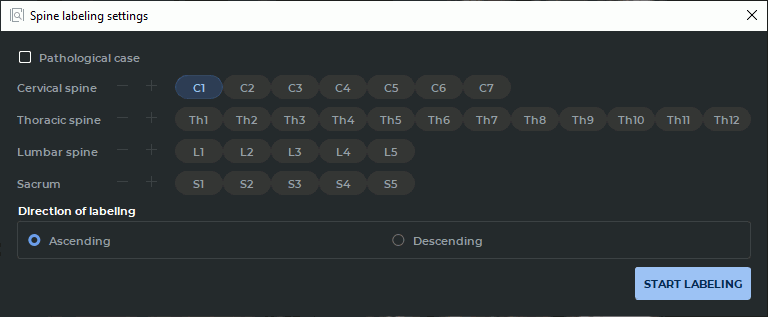
When the Spine labeling tool is activated, the Spine labeling settings window with the current settings (see Fig. 2.98) is displayed.
In the Spine labeling settings dialogue box, the standard number of vertebrae for each
region of the human spine is shown. To change the number of vertebrae for any
region, check the Pathological case box. Change the number of vertebrae with the
Remove vertebra  and Add vertebra
  buttons within the [N-2,
N+2] range, where N is the standard number of vertebrae for the respective spine
region. To reset to the standard number of vertebrae, uncheck the Pathological case
box.
buttons within the [N-2,
N+2] range, where N is the standard number of vertebrae for the respective spine
region. To reset to the standard number of vertebrae, uncheck the Pathological case
box.
Select the first vertebra to start labeling with. By default, the first cervical vertebra C1 is chosen.
Select the labeling order:
Ascending (selected by default). The vertebrae are labeled from the first selected vertebra to S5;
Descending. The vertebrae are labeled from the first selected vertebra to C1.
To start the labeling process, close the Spine labeling settings dialogue box by clicking the
START LABELING button or by clicking  in the window heading.
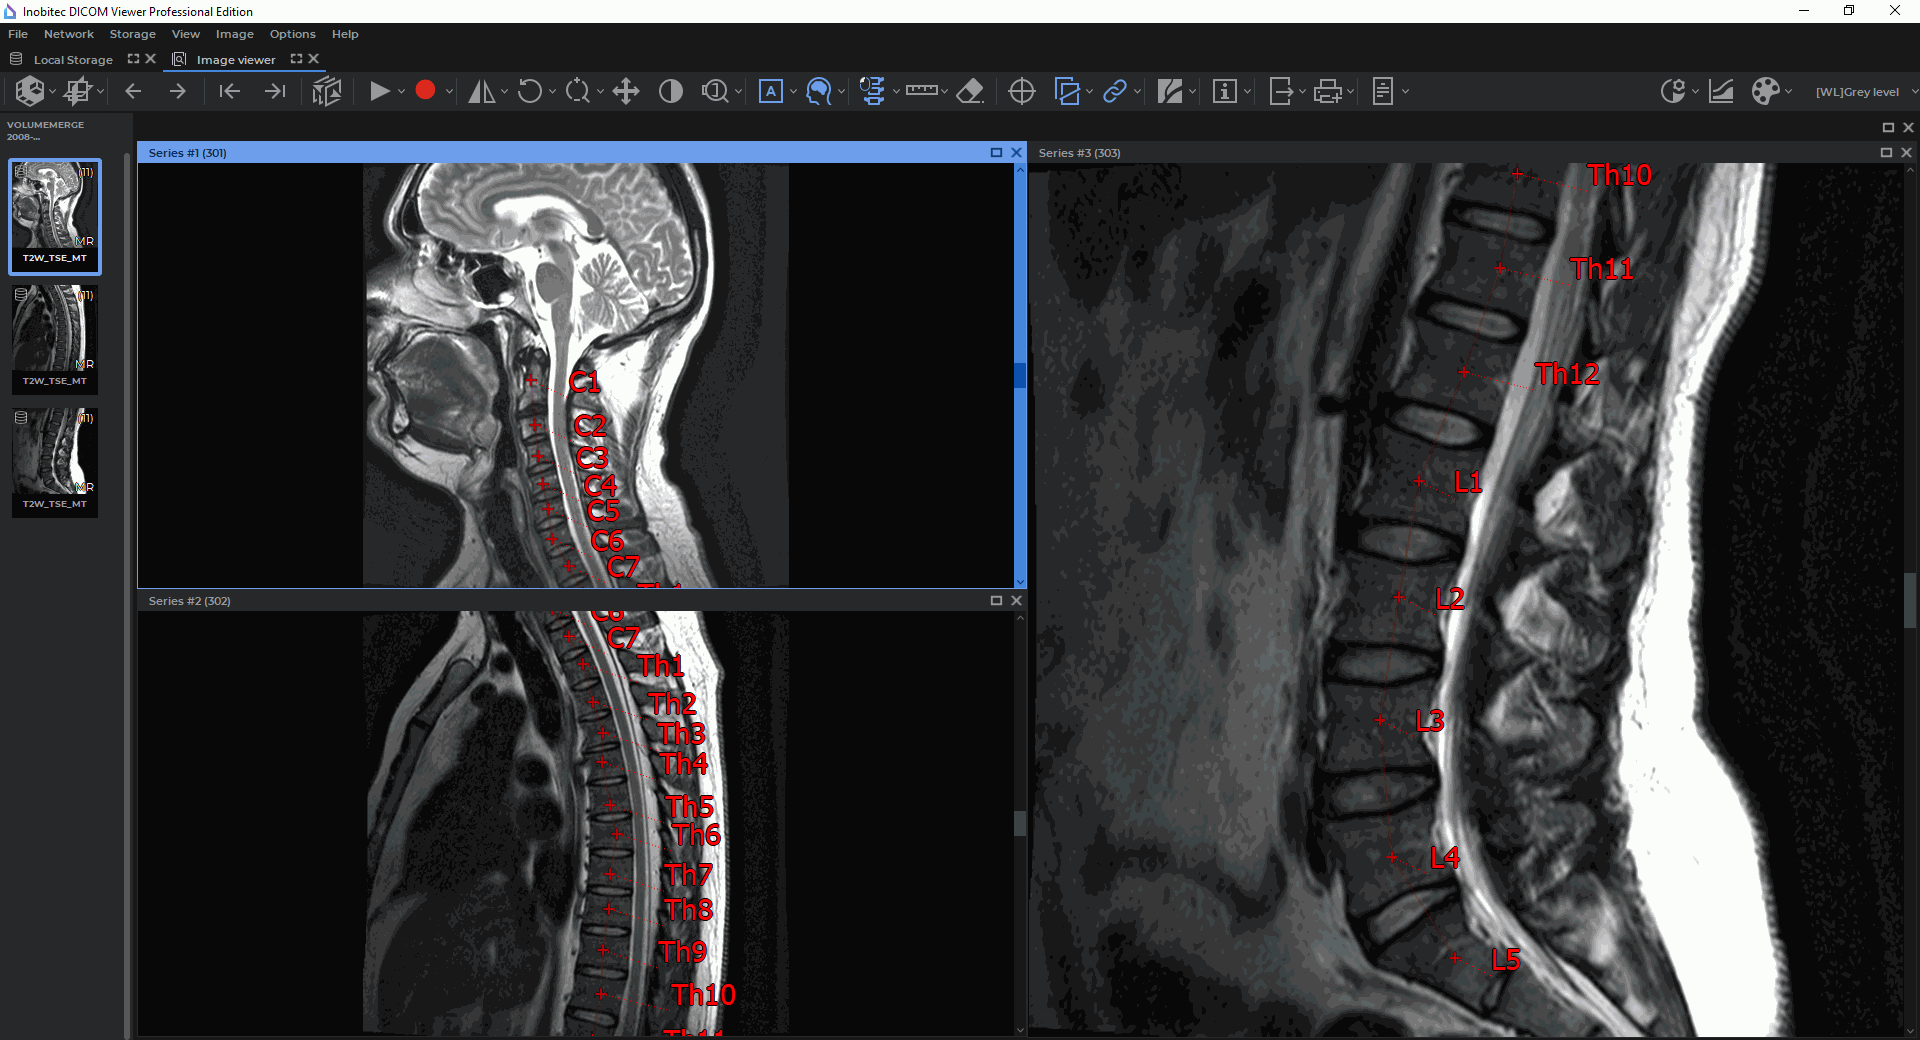
Click the mouse button in the place where the first label is to be placed. Move the cursor to the place where the next label is to be placed and click the mouse button again. If the study series have the same FrameOfReferenceUID (0020,0052) tag value and the same frame of reference, then labels will be shown for series with the same frame of reference (see Fig. 2.99).
The current set of labels will be completed when the user double-clicks the mouse or when the last vertebra is reached (Ascending is S5; Descending is C1).
To cancel an incomplete set of labels, press Esc on the keyboard.
The DICOM Viewer allows you to perform the following actions with labels:
Drag. Locate the cursor on the figure line or text and drag the object, holding down the left mouse button or the button to which this tool is assigned.
Drag a point (an apex for an arrow or polygon and a rectangle apex for an ellipse). Locate the cursor on a point and drag the point, holding down the left mouse button or the button to which this tool is assigned.
Delete. Locate the cursor on the label border and press the Delete key on the keyboard, or right-click the mouse and select the Remove object item from the context menu.
Set render params. Locate the cursor on the label border, right-click the mouse and select the Tool options... item from the context menu. In the dialog box that appears, set the line color and thickness for a figure or the font color and size for text. If you want to see a dotted line connecting the label to the respective vertebra, check the Footnote line box. The box is checked by default.
If the box Set as default checked, these settings will be applied by default when creating new annotations. Click OK to apply the changes or CANCEL to cancel the actions.
Edit text label. Locate the cursor on the text, right-click the mouse, and select the Edit text command from the context menu.
To set the default render parameters, click on the right side of the ![]() button and select the
command Default tool options... In the Tool options dialog box, set the line color and thickness
for a figure or the font color and size for text. If you want to see a dotted line connecting the
label to the respective vertebra, check the Footnote line box. The box is checked by
default.
button and select the
command Default tool options... In the Tool options dialog box, set the line color and thickness
for a figure or the font color and size for text. If you want to see a dotted line connecting the
label to the respective vertebra, check the Footnote line box. The box is checked by
default.
To delete all objects, click the Delete all annotations and measurements  button. In
the dialog box that appears, Click YES to delete or NO to cancel. If you want the DICOM
Viewer to always delete annotations and measurements without this confirmation, check the box
Don‘t show this dialog again and click YES. If you want the DICOM Viewer to show the
confirmation dialog, check the box Ask before deleting all annotations and measurements (see
Section 16.7.1).
button. In
the dialog box that appears, Click YES to delete or NO to cancel. If you want the DICOM
Viewer to always delete annotations and measurements without this confirmation, check the box
Don‘t show this dialog again and click YES. If you want the DICOM Viewer to show the
confirmation dialog, check the box Ask before deleting all annotations and measurements (see
Section 16.7.1).
 | Attention! All measurements and other objects created manually will be deleted. |