| This function cannot be used for establishing a diagnosis |
____________________________________________________________________________________________
Functionality is available in a separate module which is activated in the Pro edition for an extra fee
____________________________________________________________________________________________
| | This function cannot be used for establishing a diagnosis |
The following series are suitable for perfusion parameters estimation:
multiphase MR series. The minimal recommended phase number for brain perfusion parameters estimation is 40;
multiphase CT series.
____________________________________________________________________________________________
Functionality is available in a separate module which is activated in the Pro edition for an extra fee
____________________________________________________________________________________________
| | This function cannot be used for establishing a diagnosis |
To open series in the perfusion analysis module:
Open a series in the View Flat Images window.
Make sure that the series images are sorted by image position and phase (For details on how to sort images see Section 2.1).
Select the main menu Image and the Perfusion item.
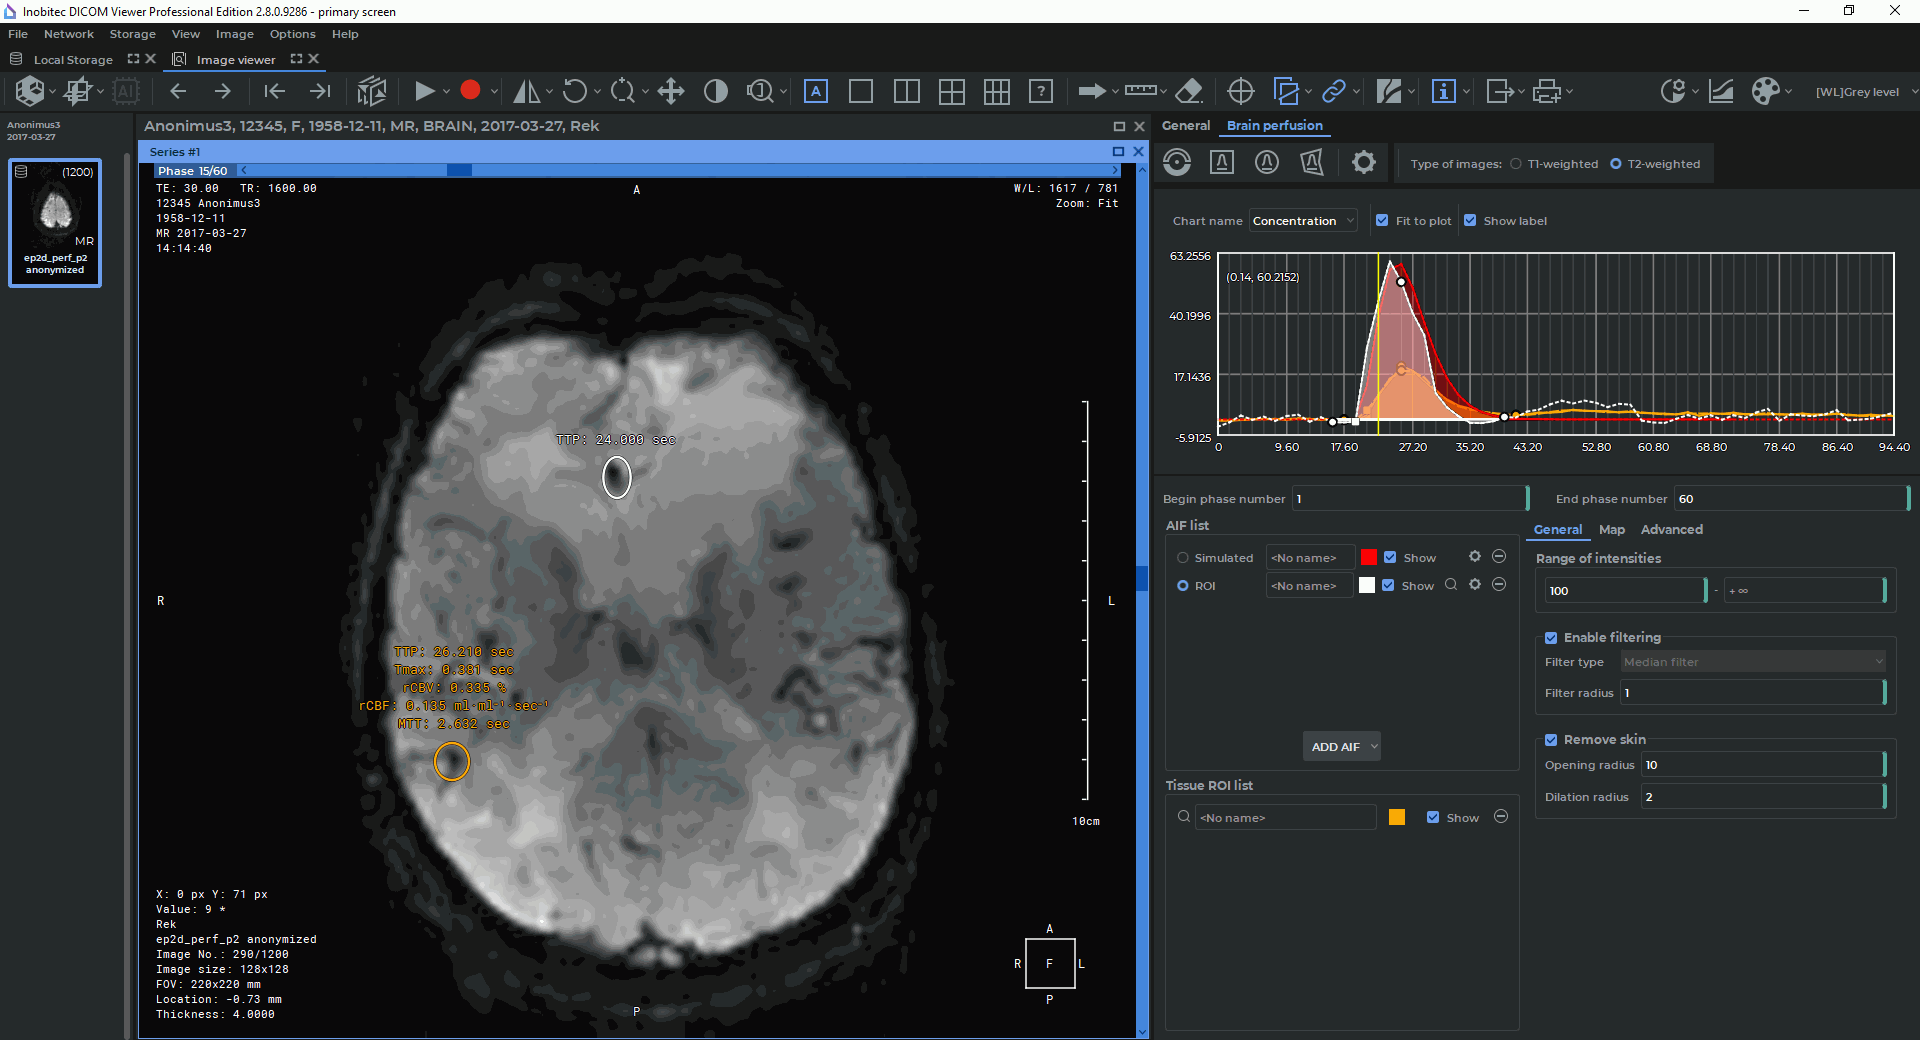
The perfusion parameters estimation panel will be displayed on the right side of the window (Fig. 2.34)
This panel has two tabs: General and Brain perfusion. The General tab allows for evaluation of the parameters of general perfusion analysis for different types of tissue. The Brain perfusion tab is used for evaluation of the cerebral parameters of brain tissue perfusion.
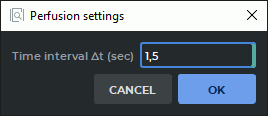
If the time interval between phases has not been set automatically, when you open the perfusion panel, you will see a dialog box (Fig. 2.35) where you need to specify the time interval between phases (see Section 2.20.2).
If the series is not suitable for Perfusion Parameters Estimation, then the The current series don‘t fit in perfusion message will be displayed on the Perfusion Parameters Estimation panel.
____________________________________________________________________________________________
Functionality is available in a separate module which is activated in the Pro edition for an extra fee
____________________________________________________________________________________________
| | This function cannot be used for establishing a diagnosis |
The time interval between phases is set automatically on the basis of the DICOM tags for the series. The tags used for determining the time interval are listed below in order of priority:
AcquisitionDate (0008,0022) and AcquisitionTime (0008,0032);
AcquisitionDateTime (0008,002A);
FrameAcquisitionDateTime (0018,9074);
ContentDate (0008,0023) and ContentTime (0008,0033);
TriggerTime (0018,1060).
If the time interval between phases has not been set automatically, when you open the perfusion panel, you will see a Perfusion settings dialog box (Fig. 2.35).
In the Time interval Δt settings block, select the type of time interval between phases by setting the toggle switch to the corresponding position.
If a variable interval type was automatically detected in the series when the perfusion panel was opened, the Variable switch will be available and selected by default. For series with a fixed interval type, the Fixed switch is selected by default, and the Variable switch is unavailable.
In the Value (sec) field, the user can change the fixed interval value in seconds. The value must be ≥0,01.
Click OK to apply the changes, or CANCEL to cancel them. To reset the settings to the values that were automatically set when the perfusion panel was opened for the current series, click DEFAULTS. If the series tags do not contain data for determining the time interval, the DEFAULTS button will be hidden.
After the time interval between phases has been changed, all the parameters for tissue ROI and maps are reevaluated.
To try entering the time interval between phases again, click the Settings  button on the
perfusion panel.
button on the
perfusion panel.
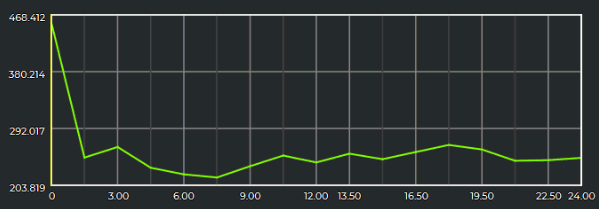
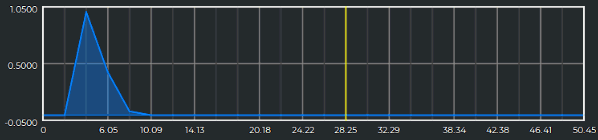
The tissue ROI and AIF graphs are plotted taking into account the interval between phases (see Section 2.20.3). The step of the graph’s horizontal scale is equal to the time interval between phases (Fig. 2.36).
____________________________________________________________________________________________
Functionality is available in a separate module which is activated in the Pro edition for an extra fee
____________________________________________________________________________________________
| | This function cannot be used for establishing a diagnosis |
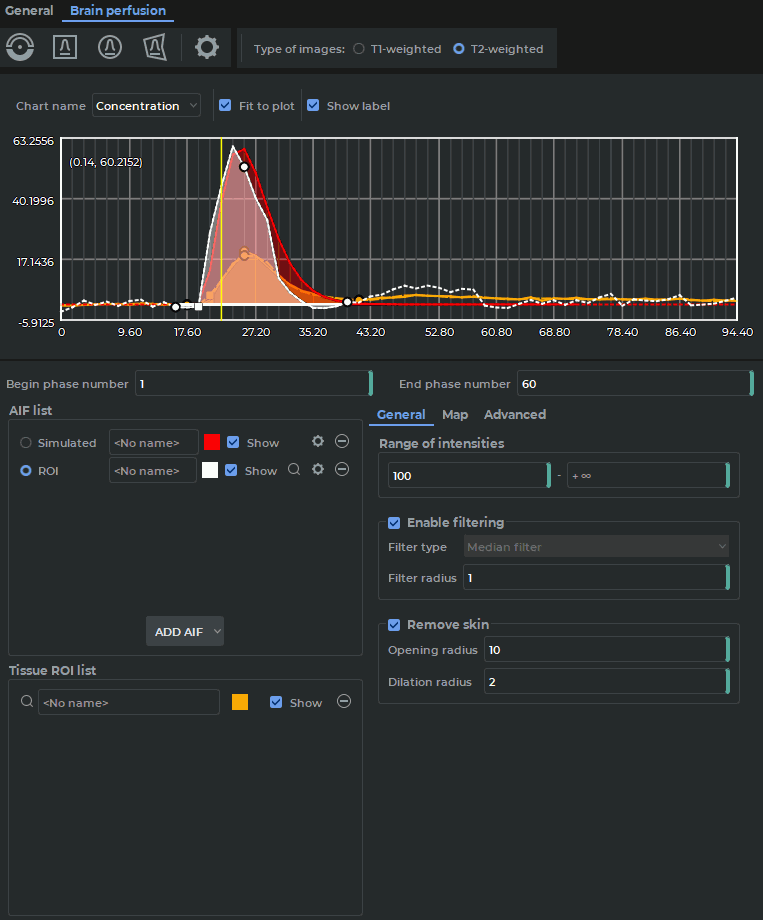
To estimate brain perfusion parameters, go to the Brain perfusion tab.
To add a simulated artery input function (AIF), proceed as follows:
Click the Add AIF. To create a simulated AIF, choose Simulated in the drop-down list.
Provide the following AIF parameters:
Appearance time (time before the commencement of the first bolus passage);
Time to concentration peak;
Concentration peak value;
Sharpness.
The chart shows a simulated AIF built on the basis of the stated parameters.
Click OK to create a simulated AIF or Cancel to cancel.
To create an AIF with the help of ROI:
Find the image that shows the artery.
Click the Add AIF button, and choose ROI in the drop-down list.
Activate one of the following tools — ROI rectangle  , ROI ellipse
  or ROI
polygon
or ROI
polygon  — on the perfusion parameters estimation panel with the left, right, or
middle mouse button. To continue work with the same tool, use the button with which
the tool was activated. For details on tool management, see Section 1.14.
— on the perfusion parameters estimation panel with the left, right, or
middle mouse button. To continue work with the same tool, use the button with which
the tool was activated. For details on tool management, see Section 1.14.
Build ROI around the artery. Graphs of artery input fucntion for each ROI pixel will be displayed at the bottom of the Perfusion Parameters Estimation panel. A ROI AIF graph is an averaged graph based on the graphs for the selected pixels. By default, all the pixels are selected.
To adjust the constructed ROI AIF, highlight several pixel graphs in ROI. To do that, select the graphs by left-clicking on them while holding the Ctrl key (or the Command key for macOS), or else you can move the mouse while holding the left mouse button. All the pixel graphs are highlighted by default. If you change the ROI, the selected pixel graphs will be reset. Click OK to build an AIF on the basis of the ROI, or Cancel to cancel.
To limit the interval of the phases for which the parameters are calculated, enter the
numbers of the first and the last phase in the respective fields, and press Enter key on
the keyboard. You may also move the interval limits on the chart. To do that, pause the
mouse pointer on the limit so that it appears as ![]() and move the limit while holding
the left mouse button.
and move the limit while holding
the left mouse button.
If the peak on the intensity graph is negative, you need to switch the Type of images to T2-weighted (the default value). The other value is T1-weighted. The Type of images setting is only used for MPT study series.
The AIF added will be displayed on the AIF list panel. If the AIF is based on a complete model,
its name will start with the word "Simulated", if it is created with the help of ROI, its name will start
with "ROI". To choose a name for an AIF, left-click the input box and print the name. All the AIF
graphs are shown in dotted line. To apply a certain AIF, click on the respective AIF switch. To show
or hide a certain AIF, check or uncheck the Show box. To change the pixels selected in ROI, click
Settings for the respective AIF. To go to the image for which the AIF was created, click  on the right-hand side of the name. To delete the selected AIF, click the
  Delete
button.
Delete
button.
The charts may show:
The intensity values (for AIF with ROI, tissue ROI);
The concentration values (for all the AIF, tissue ROI);
The response function values (for tissue ROI).
Select Intensity, Concentration, or Response in the drop-down list over the chart. The Response chart is built for tissue ROI on the basis of the data for the AIF selected.
The X-axis shows the time, while the Y-axis shows the intensity, concentration, or relative bolus concentration (depends on the chart selected).
To move the chart along the vertical axis, move the mouse up or down while holding the left mouse button and the Shift key. To resize the chart, move the mouse up or down while holding the left mouse button and the Ctrl key (or the Command key for macOS). If you check the Fit to plot box, the graph will be fitted to the window size. This box is checked by default. If you check the Show label box, the values will be shown in the point where the cursor is placed. This box is also checked by default.
The concentration graph for ROI objects has the following key points:
The point showing the commencement of the bolus passage through the tissue ROI (a round point);
The point showing the bolus peak concentration in the tissue ROI (a round point);
The point showing the end of the first bolus passage through the tissue ROI (a round point);
The point showing the steepest slope of the concentration curve (a square point).
To build a ROI for evaluating the intensity, concentration, or response values, proceed as follows:
Activate one of the following tools — Point value  , ROI rectangle , ROI
ellipse , or ROI polygon — with the left, right or middle mouse button.
To continue work with the same tool, use the button with which the tool was activated.
For details on tool management, see Section 1.14.
, ROI rectangle , ROI
ellipse , or ROI polygon — with the left, right or middle mouse button.
To continue work with the same tool, use the button with which the tool was activated.
For details on tool management, see Section 1.14.
Build a ROI object for the area you need.
Configure the settings jn the General tab:
In the Range of intensities section, set the minimum and the maximum value of the intensity range for pixels. A pixel falls within this range if at least one of the values of the respective graph of intensities built by phases falls within this range. The following requirements must be met:
The values provided must be integers;
The intensity value in the left field must be smaller than the value in the right field.
The default values are from 100 to +∞ for MRI-series and from 0 to 300 for CT-series. If the ROI does not contain any pixels falling within this range, no graph will be built for this ROI.
In the Enable filtering section, you can enable/disable the use of the smoothing filter for pixel intensity distribution graphs in order to set the signal-to-noise ratio. By default, the filter is enabled.
Choose the type of filter in the Filter type drop-down list. By default, the Median filter is enabled. At present, only one algorithm of raw data conversion with the median filter has been implemented. The list of filters will be expanded.
Provide the value in pixels in the Filter radius field. Only integers ≥ 1 must be entered. The filter radius determines the degree of smoothing for the graph of intensities (the greater is the value, the higher is the degree of smoothing).
The default value of the filter radius is 1 for MRI series and 3 for CT series.
In the Remove skin section, you can enable/disable the deletion of skin pixels. By default, the filter is enabled. Provide integer values in the Opening radius and Dilation radius fields. The default values are 10 for Opening radius and 2 for Dilation radius.
The ROI built will be shown on the Tissue ROI list.
At the top of the perfusion parameters estimation panel, the graphs depicting the changes in intensity, concentration, or response values across time are shown. These graphs are presented as a solid line. To switch between the Intensity, Concentration, and Response parameters, choose the value you need from the Chart name drop-down list.
You may perform the following actions with the study subjects (AIF with ROI, simulated AIF, or tissue ROI):
Rename.
Change a color. Click the color button to the right of the AIF or ROI name.
Change visibility. To make an AIF or ROI invisible, uncheck the box for the selected AIF or ROI.
Move the phases. If the patient moves while scanning is being performed, the tissues for which AIF and ROI are to be built are displaced, and the phases are changed. The DICOM Viewer provides an opportunity to build AIF and ROI separately for each phase. To move an AIF or ROI for the current phase, hold down the Ctrl key (or the Command key for macOS) while moving; for the current and all the following phases hold down the Shift key; for the current and all the previous phases hold down the Alt key (or the Option key for macOS). You cannot resize the ROI for a particular phase. If you try to resize the ROI for a particular phase or phase subset, the ROI for the other phases will be resized accordingly. Tissue ROI resizing and relocation only affects the evaluation of the parameters of the selected tissue area.
Move to the next slice. To move an AIF or ROI to the next slice, choose Move ROI to previous slice or Move ROI to next slice in the right-click menu.
Remove. Click the button for selected AIF or ROI.
To go to image containing AIF or ROI, click the button.
The values of the following parameters are shown for ROIs:
Time to peak (TTP);
Cerebral blood flow (rCBF);
Cerebral blood volume (rCBV);
Time to peak of response (Tmax);
Mean transit time (MTT).
____________________________________________________________________________________________
Functionality is available in a separate module which is activated in the Pro edition for an extra fee
____________________________________________________________________________________________
| | This function cannot be used for establishing a diagnosis |
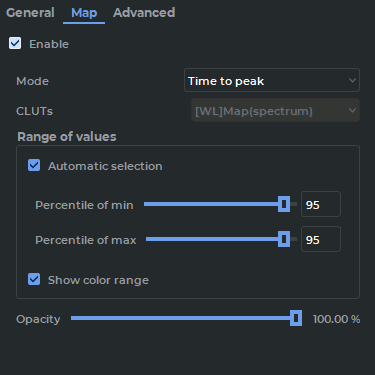
To activate the map display mode, check the Enable box on the Map tab of the perfusion panel. This box is unchecked by default.
In the Mode drop-down list, choose one of the preset map display modes. The following map display modes are available:
Conventional. One map for one selected perfusion parameter is displayed in the series window. The option is shown in the Mode list as: <Full parameter name>, e.g. Time to peak (Fig. 2.38a);
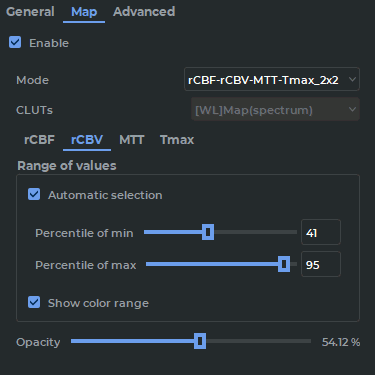
Multimap. Several maps for different perfusion parameters of the same slice are displayed
simultaneously in the same window. The option is shown in the Mode list as: <Short
name of parameter 1>…<Short name of parameter l>_n×m, where l=n×m; n is the
number of lines, and m is the number of columns for displaying images in the series
window.
E.g. rCBF-rCBV-MTT-Tmax_2x2 (Fig. 2.38b). In the Map tab, an additional tab bar
with map parameters is displayed.
If you choose the multimap mode, maps are automatically displayed in the series window. If the multimap mode is enabled, you cannot change the arrangement of the images via the context menu. To escape from the multimap menu, choose the Conventional mode or disable the map display function by unchecking the Enable box in the Map tab.
The following modes are available for the General tab:
Time to peak;
Area under curve;
Maximal slope;
TTP-Area-Slope_1x3.
If at least one AIF has been provided, the following modes are available for the Brain perfusion tab:
Time to peak;
Area under curve;
Maximal slope;
TTP-Area-Slope_1x3;
Cerebral blood flow;
Cerebral blood volume;
Mean transit time;
Time to peak of response;
rCBF-rCBV-MTT-Tmax_2x2.
If no AIF has been provided, you will only be able to use the modes that are available in the General tab.
The following parameters are provided for a map:
CLUTs. A drop-down list of color tables that determine the map color spectrum. The setting applies to all displayed maps. The "[WL]Map(spectrum)" color table is used by default. Users may create their own color tables with the Perfusion tag. The user’s color tables are added to the drop-down list.
The Range of values table is used for setting the minimum and maximum map values.
If the Automatic selection box is checked, the input fields for the minimum and
the maximum map value percentile ranks are displayed. The minimum percentile rank
determines the percentage of pixels for which the parameter value is above the minimum
range value. The maximum percentile rank determines the percentage of pixels for which
the parameter value is below the maximum range value. When the percentile ranks are
set, the entered values are checked. The value range for each field is from 1 to 100. The
sum of the minimum and the maximum percentile ranks must be more than 100. If the
entered value is invalid, then after you press Enter key on the keyboard, the previous
valid value will be restored.
If the Automatic selection box is unchecked, the input fields for the minimum and
the maximum map values are displayed. The minimum and the maximum map values
are shown at the beginning and the end of the color range. By default, the Automatic
selection box is checked, with both percentile ranks at 95%.
Opacity. By moving the slider, you can set the map opacity.
In the multimap mode, Range of values and Opacity settings are provided separately for each map for the selected parameter available in this mode. You can select a map from the tab bar (Fig. 2.38b).
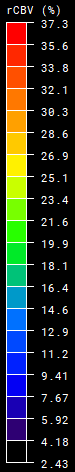
When the map is activated, in the left-hand side of the window you see a color range (Fig. 2.39). Above the range, you will see the short or abbreviated name of the parameter. The parameter units are shown in parentheses.
To hide the range, uncheck the Show color range box on the Range of values panel. This box is checked by default. In the multimap mode, the range visibility is set individually for each parameter.
To change the range values, move your mouse over the upper or the lower bound, so that it looks
like  . Then move the bound outwards to enlarge the range or inwards to shrink it. The bound
value will be displayed when moved. When you release the mouse button, the range will be adjusted
and the range values will be saved. The Automatic selection box on the Range of values panel
will be unchecked. In the input fields, you will see the minimum and the maximum color range
values.
. Then move the bound outwards to enlarge the range or inwards to shrink it. The bound
value will be displayed when moved. When you release the mouse button, the range will be adjusted
and the range values will be saved. The Automatic selection box on the Range of values panel
will be unchecked. In the input fields, you will see the minimum and the maximum color range
values.
____________________________________________________________________________________________
Functionality is available in a separate module which is activated in the Pro edition for an extra fee
____________________________________________________________________________________________
| | This function cannot be used for establishing a diagnosis |
 | The Bayesian estimation algorithm is unavailable for series with different time intervals between phases. |
To use Bayesian estimation in series with a variable interval, set a fixed interval between phases in the Perfusion settings window (Fig. 2.35).
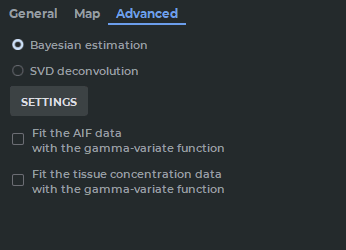
Select the algorithm by clicking the Bayesian estimation radio button in the Advanced tab on the Brain perfusion panel (Fig. 2.40).
To set the algorithm parameters, click on the SETTINGS button.
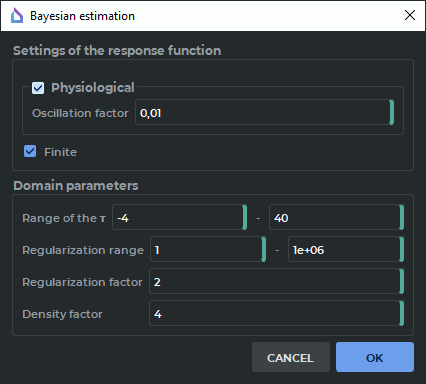
In the Bayesian estimation dialog box (Fig. 2.41) set the following parameters:
The section Settings of the response function:
To enable/disable oscillation amplitude regulation for the function graph, check/uncheck the Physiological box. Regulation is enabled by default.
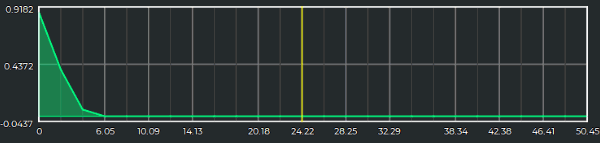
Specify the oscillation factor value in the Oscillation factor field. Permissible values are all non-negative real numbers. The default value is 0,01; The oscillation factor provides for the maximum permissible ratio of the oscillation amplitude value to the peak value of the response function graph. Figures 2.42 and 2.43 show response function graphs for the same ROI but different oscillation factor values.
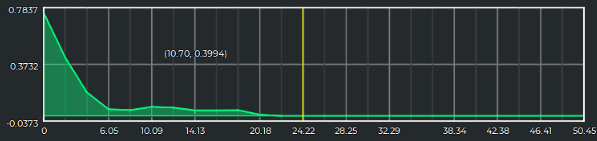
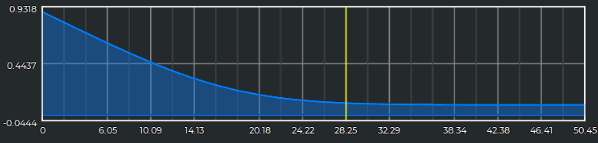
The Finite option enables/disables transformations used to create response function graphs decreasing to zero over finite time after reaching the peak. The option is enabled by default. Figures 2.44 and 2.45 show response function graphs for the same ROI but different Finite option values.
The following parameters are specified in the Domain parameters section:
The minimum and maximum Range of the T values. The values provided must be real numbers. The lower bound must be ≤ -4, while the upper bound must be ≥ 0. The default range of values is -4 to 40.
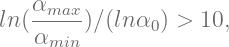
The minimum and maximum Regularization range values. The values provided must be real numbers. The minimum range value must be ≥ 1. The maximum range value must comply to the following formula:
| (2.1) |
Where αmax is the maximum regularization range value,
αmin is the minimum regularization range value,
and α0 is the regularization factor.
The default range of value is 1 to 1e6 (1000000);
Regularization factor. The value provided must be a real number more than 1 and complying to the formula 2.1.
The default value of the regularization factor is set to 2;
Density factor. The entered value must be an integer greater than 1. The default setting is 4.
Click the OK button to apply the algorithm settings or CANCEL to cancel.
If any of the parameters is changed, the following values will be reevaluated in the Bayesian estimation dialog box:
Parameters for the tissue ROI provided.
Parameters maps for rCBF, rCBV, MTT, and Tmax parameters (if a map display mode with one of the listed parameters has been set).
To enable AIF smoothing, check the Fit the AIF data with the gamma-variate function box. If you enable the smoothing function, the ROI and AIF graphs will be smoothed. Besides, the TTP, rCBV, rCBF, MTT, and Tmax parameters for ROI and maps will be re-evaluated. Simulated AIFs are not smoothed as they are initially built with the help of the gamma-variate function.
To enable the smoothing of concentration charts, check the Fit the AIF tissue concentration data with the gamma-variate function box. If you enable this function, all the concentration graphs for tissue ROI will be smoothed. Besides, the TTP, rCBV, rCBF, MTT, and Tmax parameters for ROI and maps will be re-evaluated.
In most cases, if you enable AIF or concentration graphs smoothing, it does not affect the TTP parameter value.
____________________________________________________________________________________________
Functionality is available in a separate module which is activated in the Pro edition for an extra fee
____________________________________________________________________________________________
| | This function cannot be used for establishing a diagnosis |
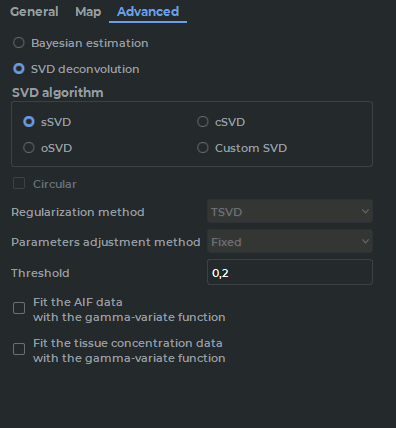
To choose a deconvolution algorithm on the basis of singular value decomposition (SVD) and set its parameters, go to the Advanced tab on the Brain perfusion panel. SVD deconvolution algorithm established by default
To apply one of the SVD deconvolution algorithms and set its parameters, click the respective option:
sSVD: a non-circular algorithm. The regularization method is TSVD, the parameters adjustment method is Stationary. The threshold (the default value of 0.2) is provided as the numeric parameter.
cSVD: a circular algorithm. The regularization method is TSVD, the parameters adjustment method is Stationary. The threshold (the default value of 0.2) is provided as the numeric parameter.
oSVD: a circular algorithm. The regularization method is TSVD, the parameters adjustment method is the oscillation method. The oscillation index (the default value of 0.05) is provided as the numeric parameter.
Custom SVD allows for setting individual combinations of regularization methods, parameters adjustment methods, and their values.
The standard sSVD algorithm is used by default.
To choose a circular custom algorithm, check the Circular box. This box is unchecked by default.
In the Regularization method drop-down list, choose the regularization method: TSVD or Tikhonov regularization. In the Parameters adjustment method drop-down list, choose the adjustment method: Fixed or Oscillation method. The threshold value or the oscillation method depends on the chosen parameters adjustment method. If you do not know what value should be provided, leave the default value. If you change the deconvolution settings, the perfusion parameters (rCBV, rCBF, Tmax, MTT) will be re-evaluated for tissue ROI and maps. The principles of work of the smoothing functions Fit the AIF data with the gamma-variate function and Fit the AIF tissue concentration data with the gamma-variate function are described in Section 2.20.5. In most cases, if you enable AIF or concentration graphs smoothing, it does not affect the TTP parameter value.