Choose a study and select the MR series on the basis of which the cardiac tissue relaxation time is to be evaluated.
Click the Cardiac analysis  button on the toolbar. To select the desired variant
of the tab placement (in the current window, in a new window, in full-screen mode), press
the arrow on the button. To open the cardiac analysis window in a new tab within the
current window, press the button. The process may take some time.
button on the toolbar. To select the desired variant
of the tab placement (in the current window, in a new window, in full-screen mode), press
the arrow on the button. To open the cardiac analysis window in a new tab within the
current window, press the button. The process may take some time.
The Cardiac analysis tool is also available in the View section of the main menu.
When the cardiac analysis module is activated, the Input data for cardiac analysis dialog box pops up (Fig. 8.10). From the drop-down list, select the T1 analysis mode.
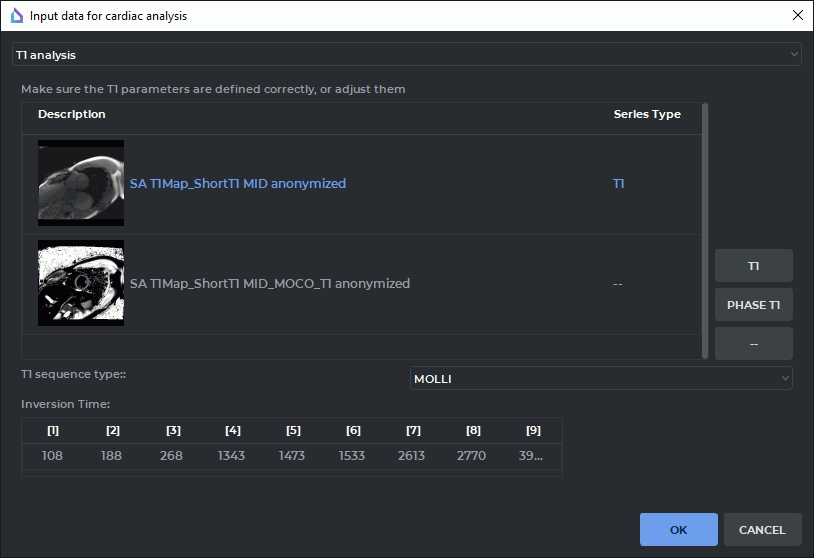
From the drop-down list, select the T1 sequence type:
-
MOLLI;
-
ShMOLLI;
-
SASHA.
Choose the series on the basis of which a T1 map will be built. To do this, select the series on the list and click the Set as T1 button.
For MOLLI and ShMOLLI sequences, you can also choose a series to be used as the signal phase. To do this, select the series on the list and click the Set as T1 signal phase button.
 | You cannot choose a series to be used as the signal phase for SASHA sequence. |
To reset the series type, select the series on the list and click the Reset the series type — button.
For SASHA T1 sequence, the saturation method used is to acquire multiple images with different timespans after the saturation pulse. It provides an opportunity to build a signal recovery curve, on the basis of which T1 is evaluated. From the drop-down list, select one of the adaptation models:
-
Two-parameter model. A simplified model which is less sensitive to noise. It was developed for perfect saturation and can underestimate T1 by 10–20% when the pulse is not perfect;
-
Three-parameter model. This model provides for high accuracy regardless of the pulse imperfection. But to ensure stability, the series must contain 8-11 images.
In the bottom part of the Input data for cardiac analysis dialog box, there is a table showing the time values for each of the T1 series images. The values are provided in the series tags. The table shows:
-
Inversion Time (TI) for MOLLI and ShMOLLI sequences;
-
Saturation Time (TS) for SASHA sequence.
Edit these values if required.
 tool on the toolbar (see Section
  ,
,  ,
,  ) on the toolbar (see Section