Click the ECG Viewer  button on the toolbar. To select the tab location (in the
current window, in a separate window or in the full screen mode), click on the arrow on
the button. To open an ECG in a new tab in the current window, click on the button.
button on the toolbar. To select the tab location (in the
current window, in a separate window or in the full screen mode), click on the arrow on
the button. To open an ECG in a new tab in the current window, click on the button.
Double-click the left mouse button on the study title on the study bar.
Double-click the left mouse button on the series icon on the series panel.
Drag the series icon to the study panel, holding the left mouse button.
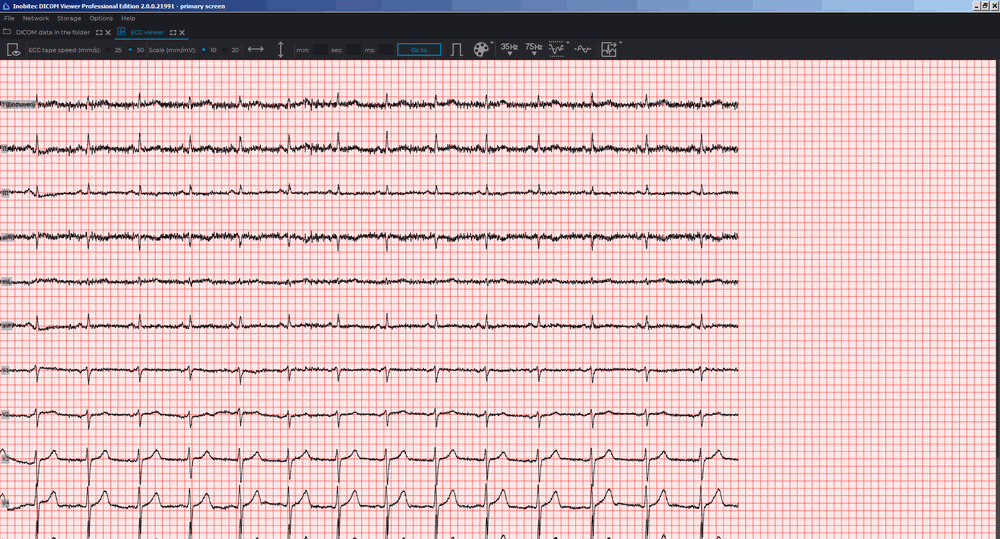
Right-click the mouse to call the context menu for the series icon and select one of the items in the ECG Viewer section. The ECG will open in a new tab in the current window (Fig. 11.1).